Download presentation
Presentation is loading. Please wait.

1
Regional Haze and Visibility in the Northeast and Mid-Atlantic States Northeast States for Coordinated Air Use Management (NESCAUM)
")
2
Regional Haze and Visibility in the Northeast and Mid-Atlantic The Drivers: CAA §169A “…calls for States to establish goals and emission reduction strategies for improving visibility in all 156 mandatory Class I national parks and wilderness areas.” 40CFR §51 “…prevention of any future, and the remedying of any existing, impairment of visibility in… which impairment results from manmade air pollution”

3
Regional Haze and Visibility in the Northeast and Mid-Atlantic CenRAP WRAP Midwest VISTAS OTC NESCAUM MARAMA Regional Planning Organizations

4
Regional Haze and Visibility in the Northeast and Mid-Atlantic Class I areas in the OTC RPO Region Moosehorn Roosevelt Campobello Acadia Presidential Range Dry River Great Gulf Lye Brook Brigantine

5
Regional Haze and Visibility in the Northeast and Mid-Atlantic 20012018201320082003-5 PM2.5 monitoring network in place EPA designates areas as being in attainment, nonattainment, or unclassifiable 2004-6 States committing to regional planning process must submit committal SIP and haze plan within 1 yr of designation Regional planning states must submit complete haze SIP 3 yrs after last designation of any state in the RPO 2011-13 Source specific BART controls go into place “Reasonable Progress” report due (and every 5 years hereafter) 2016-18 New SIP (and every 10 years hereafter) Emissions trading/ alternative control measures must be complete
 New SIP (and every 10 years hereafter) Emissions trading/ alternative control measures must be complete")
6
Regional Haze and Visibility in the Northeast and Mid-Atlantic Committal SIPs (2004-5) Agreement to participate in regional planning Showing that in-state emissions impact visibility in Class I areas out-of-state and vice-versa Description of regional planning process Commitment to submit complete SIP List of all BART-eligible sources in state
 Agreement to participate in regional planning Showing that in-state emissions impact visibility in Class I areas out-of-state and vice-versa Description of regional planning process Commitment to submit complete SIP List of all BART-eligible sources in state")
7
Regional Haze and Visibility in the Northeast and Mid-Atlantic Core SIP Requirements Calculation of natural and baseline conditions Establish reasonable progress goals for each Class I area (to achieve CAA goal by 2064) Statewide inventory of haze-related pollutants Submit long-term control strategy for each Class I area affected by in-state sources Submit monitoring strategy
 Statewide inventory of haze-related pollutants Submit long-term control strategy for each Class I area affected by in-state sources Submit monitoring strategy")
8
Regional Haze and Visibility in the Northeast and Mid-Atlantic Year 1: Nature and Scope Chapter I : Introduction Chapter II: General Description of Haze and its Effect on Visibility Chapter III : Anatomy of Haze in the Northeast Chapter IV : The Regional Haze Rule and its Planning Elements

9
Regional Haze and Visibility in the Northeast and Mid-Atlantic Report Outline (Continued) Chapter V : Haze Planning - Evaluation of Trends, Baseline Conditions, Mechanisms Chapter VI: Emissions Chapter VII : Review of Analytical Tools Chapter VIII : Monitoring of Visibility Chapter IX : Social and Economic Impacts Chapter X : Summary and Conclusions
 Chapter V : Haze Planning - Evaluation of Trends, Baseline Conditions, Mechanisms Chapter VI: Emissions Chapter VII : Review of Analytical Tools Chapter VIII : Monitoring of Visibility Chapter IX : Social and Economic Impacts Chapter X : Summary and Conclusions")
10
Regional Haze and Visibility in the Northeast and Mid-Atlantic Light Scattering and Absorption (adapted from Malm, 2000a)
")
11
Regional Haze and Visibility in the Northeast and Mid-Atlantic Contributors to Visibility Impairment

12
Regional Haze and Visibility in the Northeast and Mid-Atlantic The Deciview (dv)
")
13
Regional Haze and Visibility in the Northeast and Mid-Atlantic Measures of Visibility Natural conditions in the Northeast Extinction, b ext (Mm -1 ) Deciviews (dv) Visual Range (km) Typical day in Northeast Typical day in Mid-Atlantic 14 100 40 42 670 6 35 330 12 49 1340 3 7 20 200 21 50 80 28 160 25400 10 0 Extinction Coefficient (b ext ) = b SO4 + b NO3 + b OrgC + b Soil + b coarse + b ElemC + b Ray Visual Range (km) = 3.912 / b ext (km -1 ) Deciview (dv) = 10 ln (b ext / 10 Mm -1 )
 Deciviews (dv) Visual Range (km) Typical day in Northeast Typical day in Mid-Atlantic Extinction Coefficient (b ext ) = b SO4 + b NO3 + b OrgC + b Soil + b coarse + b ElemC + b Ray Visual Range (km) = / b ext (km -1 ) Deciview (dv) = 10 ln (b ext / 10 Mm -1 )")
14
Regional Haze and Visibility in the Northeast and Mid-Atlantic Calculating Total Light Extinction b ext (Mm -1 )=b SO4 +b NO3 +b OC +b Soil +b Coarse +b ElemC +b Ray b SO4 =3[(NH 4 ) 2 SO 4 ]f(RH) b NO3 =3[NH 4 NO 3 ]f(RH) b OC =4[OC] b Soil =1[soil] b Coars =0.6[Coarse] b ElemC =10[EC] b Ray =Rayleigh Scattering f(RH)=Relative humidity adjustment factor [ ] = concentration in g/m 3
![Regional Haze and Visibility in the Northeast and Mid-Atlantic Calculating Total Light Extinction b ext (Mm -1 )=b SO4 +b NO3 +b OC +b Soil +b Coarse +b ElemC +b Ray b SO4 =3[(NH 4 ) 2 SO 4 ]f(RH) b NO3 =3[NH 4 NO 3 ]f(RH) b OC =4[OC] b Soil =1[soil] b Coars =0.6[Coarse] b ElemC =10[EC] b Ray =Rayleigh Scattering f(RH)=Relative humidity adjustment factor [ ] = concentration in g/m 3](http://images.slideplayer.com/39/10960176/slides/slide_14.jpg "Regional Haze and Visibility in the Northeast and Mid-Atlantic Calculating Total Light Extinction b ext (Mm -1 )=b SO4 +b NO3 +b OC +b Soil +b Coarse +b ElemC +b Ray b SO4 =3[(NH 4 ) 2 SO 4 ]f(RH) b NO3 =3[NH 4 NO 3 ]f(RH) b OC =4[OC] b Soil =1[soil] b Coars =0.6[Coarse] b ElemC =10[EC] b Ray =Rayleigh Scattering f(RH)=Relative humidity adjustment factor [ ] = concentration in g/m 3")
15
Regional Haze and Visibility in the Northeast and Mid-Atlantic Northeast Natural Background Visibility Conditions

16
Regional Haze and Visibility in the Northeast and Mid-Atlantic Acadia National Park Visibility Trends

17
Regional Haze and Visibility in the Northeast and Mid-Atlantic Brigantine Wilderness Area Visibility Trends

18
Regional Haze and Visibility in the Northeast and Mid-Atlantic Great Gulf Wilderness Area Visibility Trends (May - September Data Only)
")
19
Regional Haze and Visibility in the Northeast and Mid-Atlantic Lye Brook Wilderness Area Visibility Trends

20
Regional Haze and Visibility in the Northeast and Mid-Atlantic Moosehorn Wilderness Area Visibility Trends

21
Regional Haze and Visibility in the Northeast and Mid-Atlantic Washington, D.C. Visibility Trends

22
Regional Haze and Visibility in the Northeast and Mid-Atlantic Acadia National Park Visibility Trends and Goals

23
Regional Haze and Visibility in the Northeast and Mid-Atlantic Acadia National Park Visibility Trends and Goals PM mass ( g/m 3 ) Right Scale Left Scale
 Right Scale Left Scale")
24
Regional Haze and Visibility in the Northeast and Mid-Atlantic Acadia National Park Visibility Trends and Goals

25
Regional Haze and Visibility in the Northeast and Mid-Atlantic Acadia National Park Visibility Trends and Goals Natural + Anthropogenic Mass

26
Regional Haze and Visibility in the Northeast and Mid-Atlantic Brigantine Wilderness Area Visibility Trends and Goals

27
Regional Haze and Visibility in the Northeast and Mid-Atlantic Brigantine Wilderness Area Visibility Trends and Goals

28
Regional Haze and Visibility in the Northeast and Mid-Atlantic Brigantine Wilderness Area Visibility Trends and Goals Requirement

29
Regional Haze and Visibility in the Northeast and Mid-Atlantic Brigantine Wilderness Area Visibility Trends and Goals

30
Regional Haze and Visibility in the Northeast and Mid-Atlantic Acadia National Park Speciated Contributions to Extinction 20% Worst Visibility (1997)20% Best Visibility (1997)
20% Best Visibility (1997)")
31
Regional Haze and Visibility in the Northeast and Mid-Atlantic Washington D.C. 242 Mm -1 (16 km/31.9 dv) Brigantine 189 Mm -1 (21 km/29.4 dv) Lye Brook 144 Mm -1 (27 km/26.7 dv) Great Gulf (Presidential Range) 140 Mm -1 (28 km/26.4 dv) Acadia 110 Mm -1 (36 km/24 dv) Moosehorn (Roosevelt Campobello) 96 Mm -1 (41 km/22.6 dv) 20% Worst Visibility Speciated Contributions to Extinction (1997)
 Brigantine 189 Mm -1 (21 km/29.4 dv) Lye Brook 144 Mm -1 (27 km/26.7 dv) Great Gulf (Presidential Range) 140 Mm -1 (28 km/26.4 dv) Acadia 110 Mm -1 (36 km/24 dv) Moosehorn (Roosevelt Campobello) 96 Mm -1 (41 km/22.6 dv) 20% Worst Visibility Speciated Contributions to Extinction (1997).")
32
Regional Haze and Visibility in the Northeast and Mid-Atlantic Washington D.C. 70 Mm -1 (56 km/19.5 dv) Brigantine 52 Mm -1 (75 km/16.5 dv) Lye Brook 26 Mm -1 (150 km/9.6 dv) Great Gulf (PresidentialRange) 30 Mm -1 (130 km/11 dv) Acadia 28 Mm -1 (140 km/10.3 dv) Moosehorn (Roosevelt Campobello) 27 Mm -1 (145 km/9.9 dv) 20% Best Visibility Speciated Contributions to Extinction (1997)
 Brigantine 52 Mm -1 (75 km/16.5 dv) Lye Brook 26 Mm -1 (150 km/9.6 dv) Great Gulf (PresidentialRange) 30 Mm -1 (130 km/11 dv) Acadia 28 Mm -1 (140 km/10.3 dv) Moosehorn (Roosevelt Campobello) 27 Mm -1 (145 km/9.9 dv) 20% Best Visibility Speciated Contributions to Extinction (1997).")
33
Regional Haze and Visibility in the Northeast and Mid-Atlantic Shenandoah 193 Mm -1 James River Face 201 Mm -1 Dolly Sods/Otter Creek 232 Mm -1 20% Worst Visibility Speciated Contributions to Extinction (1997)
")
34
Regional Haze and Visibility in the Northeast and Mid-Atlantic Shenandoah 45 Mm -1 James River Face 56 Mm -1 Dolly Sods/Otter Creek 51 Mm -1 20% Best Visibility Speciated Contributions to Extinction (1997)
")
35
Regional Haze and Visibility in the Northeast and Mid-Atlantic adapted from Malm (2000)
")
36
Regional Haze and Visibility in the Northeast and Mid-Atlantic Acadia National Park Seasonal Analysis of Visibility Impairment

37
Regional Haze and Visibility in the Northeast and Mid-Atlantic Brigantine Wilderness Area Seasonal Analysis of Visibility Impairment

38
Regional Haze and Visibility in the Northeast and Mid-Atlantic Seasonal Role of Nitrates Note: Nitrate represents only 9-33% of total extinction in winter (and only 2% in summer)
")
39
Regional Haze and Visibility in the Northeast and Mid-Atlantic Role of Organics OH O3O3 NO 3 Anthropogenic Sources Natural Sources Natural Oxidation Anthropogenically Enhanced Oxidation Condensation (SOA formation) PM 2.5
 PM 2.5")
40
Regional Haze and Visibility in the Northeast and Mid-Atlantic Role of Ammonia (NH 3 ) SO 4 = NO 3 - Anthropogenic Sources Natural Sources Reacts preferentially with Sulfate Enhances nucleation Accelerates particle growth Reacts with Nitrate in absence of sulfate wintertime PM 2.5
 SO 4 = NO 3 - Anthropogenic Sources Natural Sources Reacts preferentially with Sulfate Enhances nucleation Accelerates particle growth Reacts with Nitrate in absence of sulfate wintertime PM 2.5")
41
Regional Haze and Visibility in the Northeast and Mid-Atlantic 3-D Eulerian AQ Model Spatial Domain Class I Area Modeling Approach Domain for Annual or Episodic models

42
Regional Haze and Visibility in the Northeast and Mid-Atlantic Class I Area Source Dispersion Modeling Domain for Annual or Episodic models Modeling Approach

43
Regional Haze and Visibility in the Northeast and Mid-Atlantic Class I Area Domain for Annual or Episodic models Source Dispersion Modeling Trajectory Analysis Modeling Approach

44
Regional Haze and Visibility in the Northeast and Mid-Atlantic Class I Area Domain for Annual or Episodic models Source Dispersion Modeling Trajectory Analysis Source Apportionment Techniques Modeling Approach

45
Regional Haze and Visibility in the Northeast and Mid-Atlantic Monitoring Programs in the East Presque Isle Moosehorn Old Town Acadia Freeport Bridgton Mt. Washington Underhill Lye Brook Boston Truro Martha’s Vineyard Quabbin Mohawk Mountain Seney Connecticut Hill 2001.) New York Brigantine Whiteface Mtn. Pinnacle Park CASTNet (Note: About half these sites will not be operational until early IMPROVE IMPROVE Protocol Sites IMPROVE Protocol Sites (former NEPART sites) IMPROVE Protocol Sites (formersites) Other Rural Speciation Sites CAMNET sites Goddard Park Arendtsville Quaker City Shenandoah James River Face Dolly Sods Linville Gorge Shining Rock Cohutta Great Smoky Mtns Mammoth Cave Cadiz Livonia Bondville
 New York Brigantine Whiteface Mtn. Pinnacle Park CASTNet (Note: About half these sites will not be operational until early IMPROVE IMPROVE Protocol Sites IMPROVE Protocol Sites (former NEPART sites) IMPROVE Protocol Sites (formersites) Other Rural Speciation Sites CAMNET sites Goddard Park Arendtsville Quaker City Shenandoah James River Face Dolly Sods Linville Gorge Shining Rock Cohutta Great Smoky Mtns Mammoth Cave Cadiz Livonia Bondville.")
46
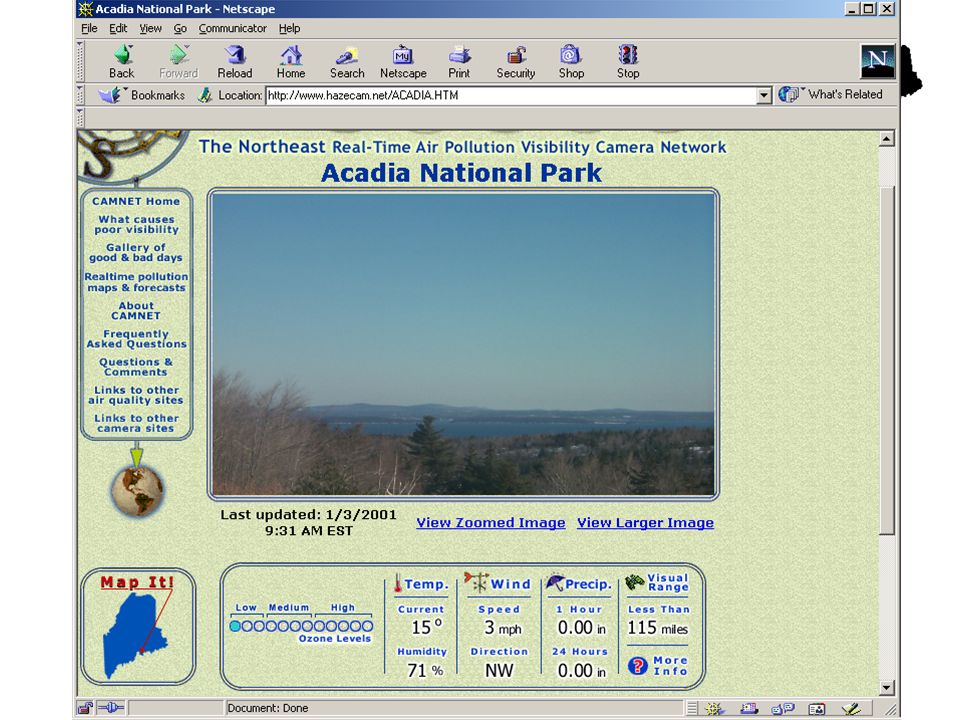
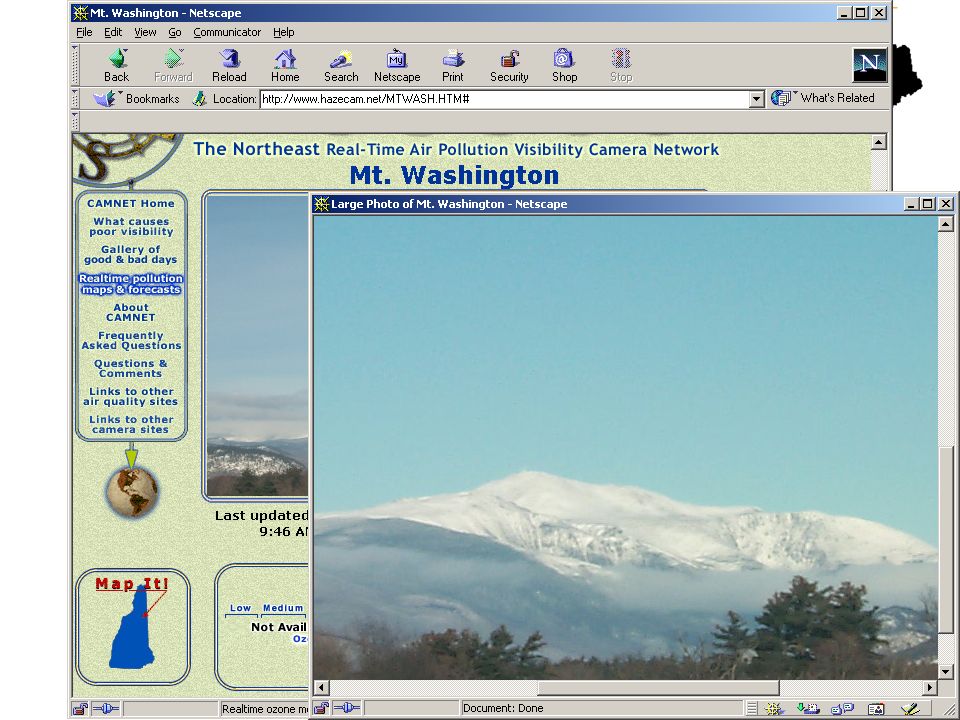
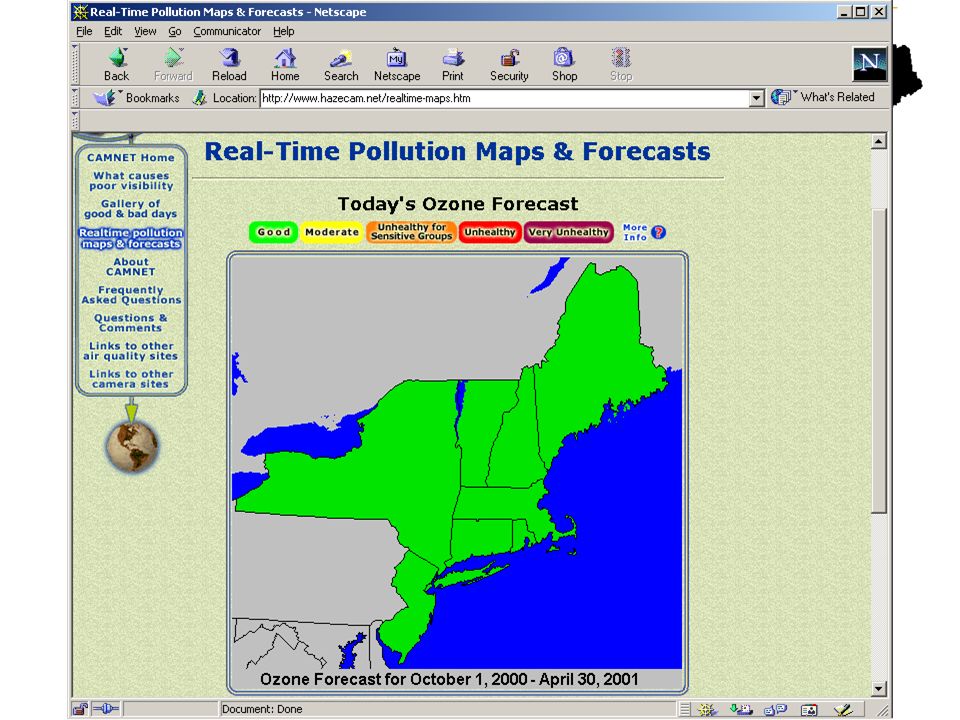
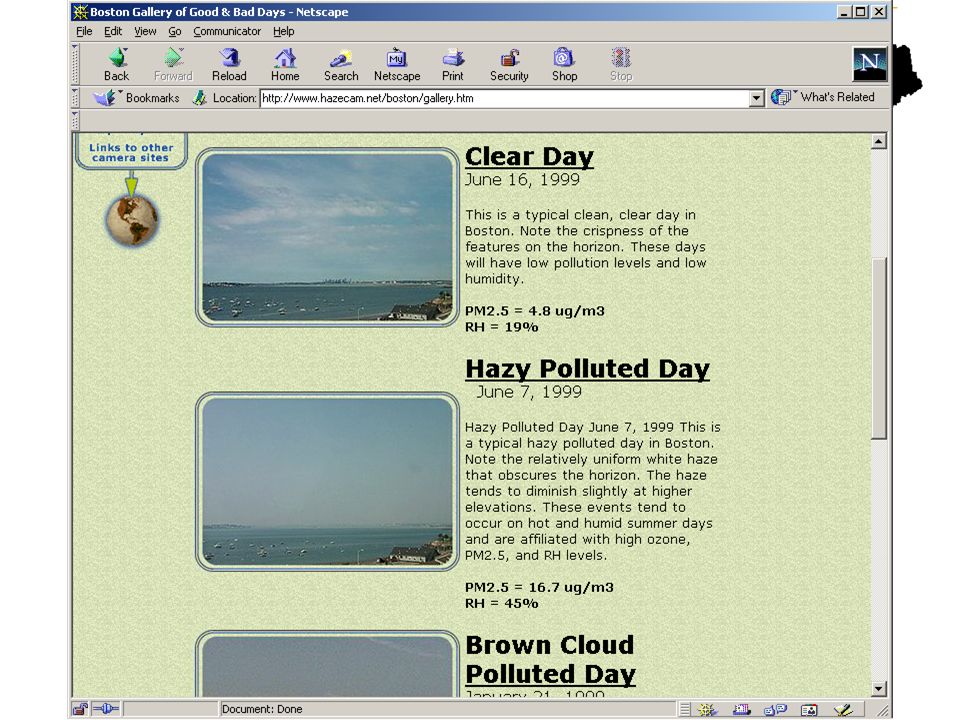
Regional Haze and Visibility in the Northeast and Mid-AtlanticCAMNET

51
CAMNET Outreach Project Proposal under development Taking comments through February 2 nd Additional funding/support is needed for full implementation Contact: Lee Alter at NESCAUM lalter@nescaum.org

52
Regional Haze and Visibility in the Northeast and Mid-Atlantic

53
Economic and Social Benefits of Visibility Improvements Over $130b per year in recreational spending. (Much of it at or near recreational sites) Improved visibility effects tourist preferences and travel expenditures. Non-valued benefits are significant. ($327m for ME; $6m for NH; and $600k to VT, Abt, 2000) Over $1.3b in health-care cost related benefits result from BART reductions in West.
 Improved visibility effects tourist preferences and travel expenditures. Non-valued benefits are significant. ($327m for ME; $6m for NH; and $600k to VT, Abt, 2000) Over $1.3b in health-care cost related benefits result from BART reductions in West..")
54
Regional Haze and Visibility in the Northeast and Mid-Atlantic Linkages with other Air Quality Programs Haze particles = PM 2.5 (increased morbidity, mortality, respiratory and cardiac disease, etc…) Sulfates and Nitrates = Acid Deposition (decreased ANC, increase N Saturation, decreased pH) Nitrates Eutrophication (deposited nitrate feeds algal blooms, depletes O 2, destroys marine ecosystem in bays and estuaries) VOCs, NO X Ozone
 Sulfates and Nitrates = Acid Deposition (decreased ANC, increase N Saturation, decreased pH) Nitrates Eutrophication (deposited nitrate feeds algal blooms, depletes O 2, destroys marine ecosystem in bays and estuaries) VOCs, NO X Ozone")
55
Regional Haze and Visibility in the Northeast and Mid-Atlantic Regional Haze and Visibility in the Northeast and Mid-Atlantic States http://www.nescaum.org/committees/haze.html NESCAUM Northeast States for Coordinated Air Use Management

56
Regional Haze and Visibility in the Northeast and Mid-Atlantic

Similar presentations

 NOx and PM Report Lee Alter Western Governors’ Association WRAP IOC NOx Issues Meeting Denver, CO July 28, 2003.>")


 2000-2010 IMPROVE DATA (for TSC 5/22/2012) Tom.>")
>")
