Download presentation
Presentation is loading. Please wait.

1
Am I Making a Difference? Using Data to Improve Practice Megan Vinh, PhD Lise Fox, PhD 2016 National Inclusion Institute May 12, 2016

2
Who’s in the room? –Who is your role? –What areas do you work in? Welcome

3
Agenda Key concepts for data-based decision- making, including: –The basics to data-based decision making –Using data to make child level and implementation decisions –Creating a culture of decision making Discussion

4
THE BASICS TO DATA- BASED DECISION MAKING

5
A Data-Decision Making Approach: Some Basic Assumptions Outcomes are identified Fidelity and outcomes are measured Data are summarized and used to: –Identify training needs –Deliver professional development –Make other programmatic changes (e.g., playground schedule, program wide expectations) –Problem solve around specific children or issues –Ensure child learning and success Data collection AND ANALYSIS is an ongoing process
 –Problem solve around specific children or issues –Ensure child learning and success Data collection AND ANALYSIS is an ongoing process")
6
Data-Based Decision Making Cycle LOOK (Evidence) THINK (Inference) ACT
 THINK (Inference) ACT")
7
Organizing for an effective problem solving conversation Problem Solution Out of Time Use Data A key to collective problem solving is to provide a visual context that allows everyone to follow and contribute

8
Using Your Data

9
So, how do I begin? What are your questions? What is your process for looking at data and making interpretations? What are the data sources you might have? Is there other data you need to collect or gather?

10
Starting with a question (or two…) All analyses are driven by questions Questions come from different sources Different versions of the same question are necessary and appropriate for different audiences. What are your critical questions?

11
What is Your Process for Looking at Data? Evidence Inference Action

12
Evidence (Look) Evidence refers to the numbers, such as “31% of children have been removed at least once” The numbers are not debatable
 Evidence refers to the numbers, such as 31% of children have been removed at least once The numbers are not debatable")
13
Inference (Think) How do you interpret the evidence? What can you conclude from the numbers? Does evidence mean good news? Bad news? News you can’t interpret? To reach an inference, sometimes you need to analyze data in other ways (ask for more evidence)
.")
14
Inference (Think) Inference is debatable -- even reasonable people can reach different conclusions Stakeholders and having a variety of perspectives can help with putting meaning on the numbers Early on, the inference may be more a question of the quality of the data
 Inference is debatable -- even reasonable people can reach different conclusions Stakeholders and having a variety of perspectives can help with putting meaning on the numbers Early on, the inference may be more a question of the quality of the data")
15
Action Given the inference from the numbers, what should be done? Recommendations or action steps Action can be debatable – and often is Another role for stakeholders and teams May involve looking at additional data and information Again, early on the action might have to do with improving the quality of the data

16
USING DATA: IMPLEMENTATION AND CHILD LEVEL

17
Two Primary Considerations Are We Doing What We Should be Doing? –Fidelity of implementation Is It Making a Difference? –Impact –Proximal to distal outcomes

18
Two Examples Reaching Potential Through Recommended Practices (RP2) Pyramid Model
 Pyramid Model")
19
RP² Data-Based Decision-Making Plan Program Implementation RP 2 : Benchmarks of Quality for Home Visiting Programs RP²: Benchmarks of Quality for Classroom Practice Implementation Recommended Practices Observation Scale – Home Visiting (RP² OS-HV) Recommended Practices Observation Scale – Classroom (RP² OS-C) Child Outcome Child Engagement Scale (Dunst & Trivette, 2014) – HV STARE: Scale for Teacher Assessment of Routine Engagement (McWilliam, 2011) - Classroom
 Recommended Practices Observation Scale – Classroom (RP² OS-C) Child Outcome Child Engagement Scale (Dunst & Trivette, 2014) – HV STARE: Scale for Teacher Assessment of Routine Engagement (McWilliam, 2011) - Classroom")
20
Data-Based Decision Making For Teachers: Child Outcomes STARE: Scale for Teacher Assessment of Routine Engagement Identifies child’s level of engagement in learning opportunities (with peers, adults and materials) Teacher completes on Target Child after Target Activity at least 2x per week Growth in engagement for target children Internal coach completes during observation
 Teacher completes on Target Child after Target Activity at least 2x per week Growth in engagement for target children Internal coach completes during observation")
21
STARE: Scale for Teacher Assessment of Routine Engagement (McWilliam, 2011)
")
24
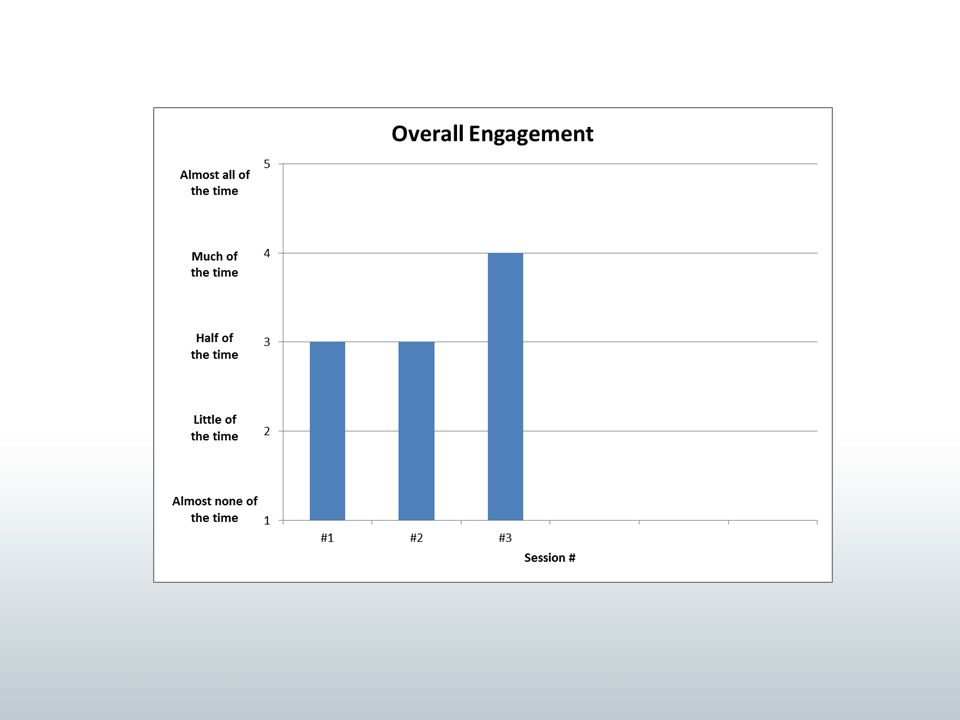
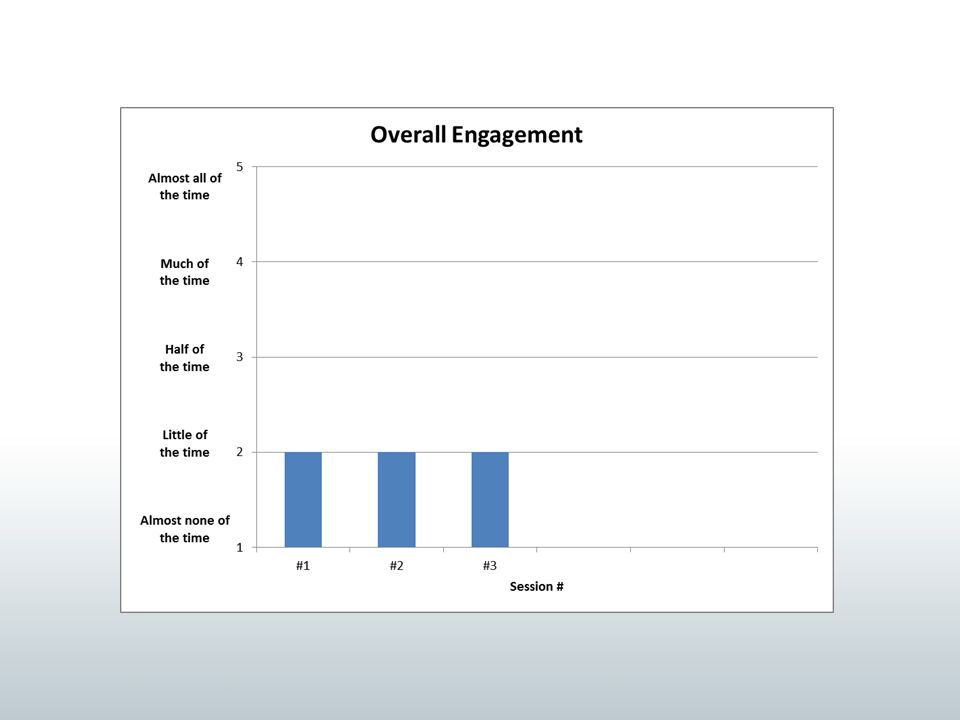
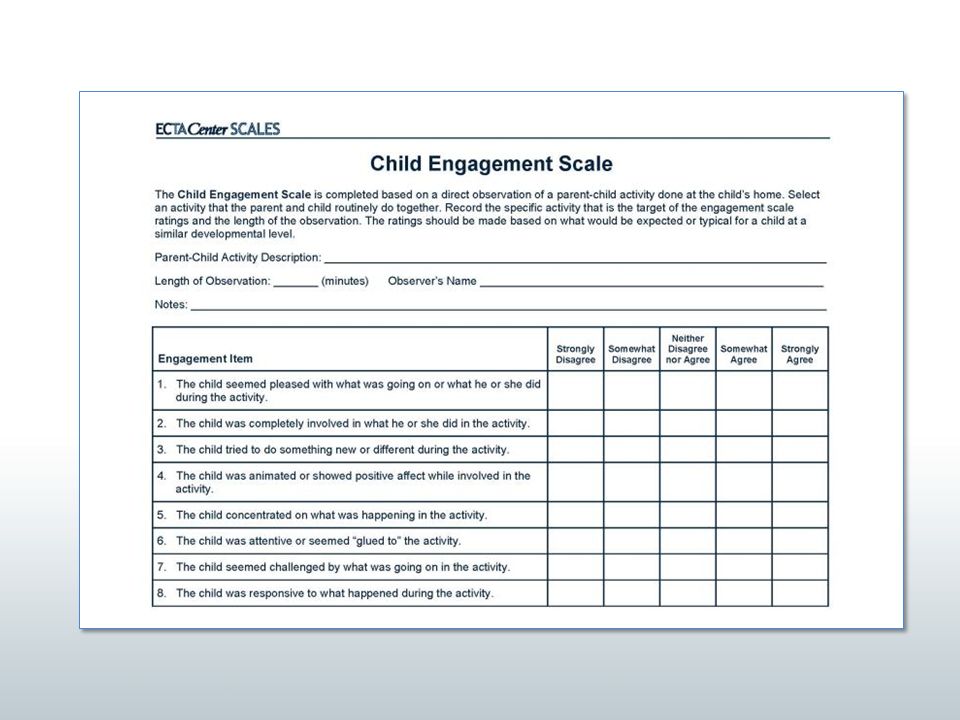
Child Engagement Scale Child Engagement Scale is designed to be used by home visitors and coaches Engagement is rated after the activity

25
Child Engagement Scale-Home Visitor Use Identify the target activity or routine that the child and parent have been doing together (one where child engagement is a struggle, where is the home visitor trying to help the parent improve the use of a practice) Home visitor rates each of the indicators after the activity ends Home visitor should share the data with the family and discuss any changes that need to be made (based on the data)
 Home visitor rates each of the indicators after the activity ends Home visitor should share the data with the family and discuss any changes that need to be made (based on the data)")
26
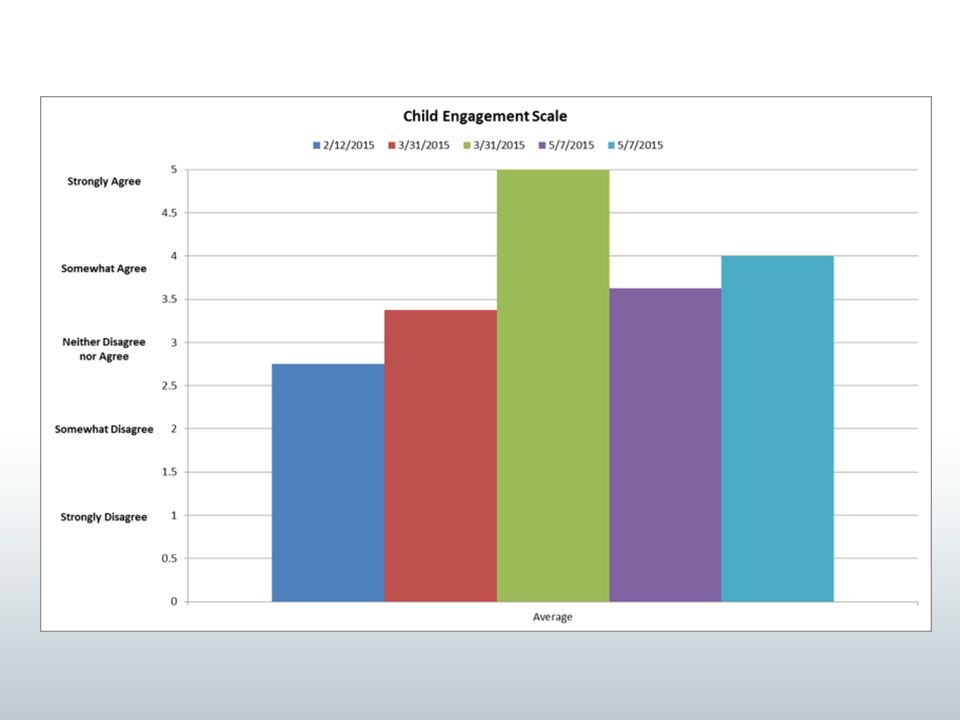
Child Engagement Scale-Coach Use Internal coach uses form in same way the home visitor does After the home visit or video observation, compare your scores with home visitor scores and clarify any definitional issues Conduct observation across time and chart child progress Use your data to provide feedback on changes for the child

29
What inferences can you make from the data? What is the level of engagement of the child in the target activity? Is the trend indicating improvement, decreasing engagement, variable engagement, no changes? Is there a relationship between child data and practitioner implementation of practices? Does the practitioner’s action plan include strategies/practices that might directly affect child engagement? Are there missing data?

30
Evaluation Plan-Pyramid Model Implementation Benchmarks of Quality Teaching Pyramid Observation Tool; TPITOS Pre-SET Program Program Incidents (calls to families, dismissals, transfer, requests for assistance, family conferences) Behavior Incident Reports Child Progress Monitoring (see PTR) Child curriculum-based assessment or rating scales
 Behavior Incident Reports Child Progress Monitoring (see PTR) Child curriculum-based assessment or rating scales")
31
Benchmarks of Quality Example Establish Leadership Team (6 benchmarks) Staff Buy-In (2 benchmarks) Family Involvement (4 benchmarks) Program-Wide Expectations (5 benchmarks) Strategies for Teaching and Acknowledging Program- Wide Expectations (3 benchmarks) Classrooms Demonstrate Adoption (5 benchmarks) Procedures for Responding to Challenging Behavior (5 benchmarks) Staff Support Plan (7 benchmarks) Monitoring Implementation and Outcomes (6 benchmarks) *Scores for critical areas range from 0 (no implementation) to 2 (full implementation
 Staff Buy-In (2 benchmarks) Family Involvement (4 benchmarks) Program-Wide Expectations (5 benchmarks) Strategies for Teaching and Acknowledging Program- Wide Expectations (3 benchmarks) Classrooms Demonstrate Adoption (5 benchmarks) Procedures for Responding to Challenging Behavior (5 benchmarks) Staff Support Plan (7 benchmarks) Monitoring Implementation and Outcomes (6 benchmarks) *Scores for critical areas range from 0 (no implementation) to 2 (full implementation")
33
What Inferences can you Make? What elements are fully in place? What elements are not in place or partially in place? Where has there been the most growth? What elements appear to be the ones needing attention? What other data might we want to examine? Are there areas for growth that might be pivotal (e.g. Buy-in, Procedures for Behavior Challenges)
.")
34
Teacher Implementation Teaching Pyramid Observation Tool (Hemmeter, Fox, & Snyder, 2014)
")
35
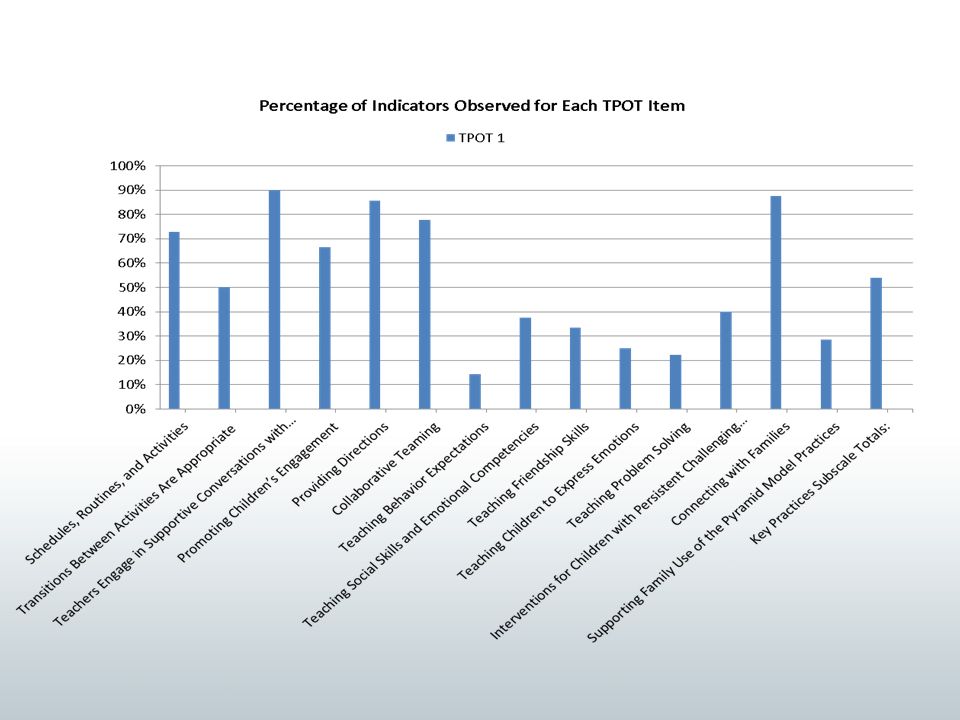
Pyramid Model Practices TPOT Designed to Measure Observation items 1.Schedules, routines, and activities (SR) 2.Transitions between activities (TR) 3.Supportive conversations (SC) 4.Promoting engagement (ENG) 5.Providing directions (PD) 6.Collaborative teaming (CT) 7.Teaching behavior expectations (TBE) 8.Teaching social skills and emotional competencies (TSC) Observation and interview items 9.Teaching friendship skills (FR) 10.Teaching children to express emotions (TEE) 11.Teaching problem-solving (TPS) Interview items 12.Interventions for children with persistent challenging behavior (PCB) 13.Connecting with families (COM) 14.Supporting Families in using Pyramid Model practices (INF) Observation of Challenging Behavior 32.Strategies for responding to challenging behavior (SCB) Red Flags Items that need immediate attention to create classroom environments and procedures that promote social and emotional competence
 2.Transitions between activities (TR) 3.Supportive conversations (SC) 4.Promoting engagement (ENG) 5.Providing directions (PD) 6.Collaborative teaming (CT) 7.Teaching behavior expectations (TBE) 8.Teaching social skills and emotional competencies (TSC) Observation and interview items 9.Teaching friendship skills (FR) 10.Teaching children to express emotions (TEE) 11.Teaching problem-solving (TPS) Interview items 12.Interventions for children with persistent challenging behavior (PCB) 13.Connecting with families (COM) 14.Supporting Families in using Pyramid Model practices (INF) Observation of Challenging Behavior 32.Strategies for responding to challenging behavior (SCB) Red Flags Items that need immediate attention to create classroom environments and procedures that promote social and emotional competence")
37
What inferences can you make? What are teacher strengths? What are areas that are lower? What other data might inform a decision? How might these data influence professional development?

39
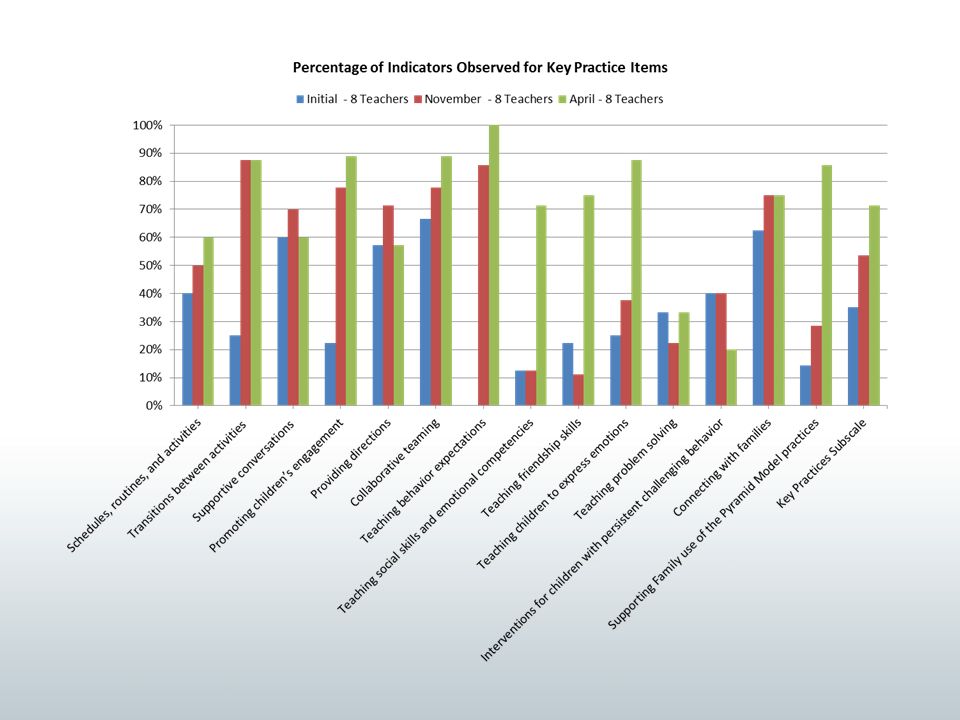
What inferences can you make? What are teacher strengths across classrooms? What are areas that are lower across classrooms? What other data might inform a decision? How might these data influence professional development?

40
CREATING A CULTURE OF DATA-BASED DECISION MAKING

41
Data – It’s a Leadership Team Responsibility Monthly review of data –Who, How often, What, Where, When Monthly review of program incidents –What’s up, what’s down, why, what should we do about it Review of all teacher fidelity measures to determine next steps, training, coaching, support Review of child progress data to ensure supports are effective

42
Cultural Barriers to Data-Based Decision Making 1.Many providers/teachers have developed their own personal metric for judging the effectiveness of their intervention/teaching and often this metric differs from the metrics of external parties (e.g., state accountability systems and school boards). 2.Many providers/teachers and administrators base their decisions on experience, intuition, and anecdotal information (professional judgment) rather than on information that is collected systematically. 3.There is little agreement among stakeholders about which child outcomes are most important and what kinds of data are meaningful. 4.Some providers/teachers disassociate their own performance and that of children, which leads them to overlook useful data. Ingram, D. S. (2004). Accountability policies and teacher decision making: Barriers to the use of data to improve practice. Teachers College Record, 106(6), 1258–1287.
 rather than on information that is collected systematically. 3.There is little agreement among stakeholders about which child outcomes are most important and what kinds of data are meaningful. 4.Some providers/teachers disassociate their own performance and that of children, which leads them to overlook useful data. Ingram, D. S. (2004). Accountability policies and teacher decision making: Barriers to the use of data to improve practice. Teachers College Record, 106(6), 1258–")
43
Technical Barriers Data-Based Decision Making 5.Data that providers /teachers want – about “really important outcomes” – are rarely available and are usually hard to measure. 6.Programs and schools rarely provide the time needed to collect and analyze data. Ingram, D. S. (2004). Accountability policies and teacher decision making: Barriers to the use of data to improve practice. Teachers College Record, 106(6), 1258–1287.
. Accountability policies and teacher decision making: Barriers to the use of data to improve practice. Teachers College Record, 106(6), 1258–")
44
Discussion Questions- Small Group Activity What are your barriers to creating a culture of data- based decision making? What are your potential solutions? What do you struggle with in being a data-based decision-maker? What are your potential solutions?

45
QUESTIONS?

46
Keeping In Touch Megan Vinh, mvinh@email.unc.edu mvinh@email.unc.edu Lise Fox, lisefox@usf.edu lisefox@usf.edu

47
The contents of this presentation were developed under a grant from the U.S. Department of Education, # H373Z120002, and a cooperative agreement, #H326P120002, from the Office of Special Education Programs, U.S. Department of Education. However, those contents do not necessarily represent the policy of the U.S. Department of Education, and you should not assume endorsement by the Federal Government. DaSy Center Project Officers, Meredith Miceli and Richelle Davis and ECTA Center Project Officer, Julia Martin Eile.

Similar presentations


>")


