Download presentation
Presentation is loading. Please wait.

1
Queuing Theory

2
Model Customers arrive randomly in accordance with some arrival time distribution. One server services customers in order of arrival. The service time is random following some service time distribution.

3
Model Ntcustomersinsystematt()# avgarrivalrate N (t) t a t. lim
# avgarrivalrate N (t) t a t. lim ")
4
Model Ntcustomersinsystematt()# avgarrivalrate N (t) t a t. lim s avgservicerate .
# avgarrivalrate N (t) t a t. lim s avgservicerate .")
5
Model Measures of Performance

6
Model Measures of Performance L=avg. # customers in system L q = avg. # customers in queue W = avg. waiting time in the system W q = avg. waiting time in the queue

7
Model Little’s Formula LW LW qq WW q 1

8
Model Steady State Ntcustomersinsystematt()# Plongrunprobabilitythatthere arencustomersinsystem n PNtn t lim{()}
# Plongrunprobabilitythatthere arencustomersinsystem n PNtn t lim{()} ")
9
M/M/1 Queue M/M/1 Queue assumes exponential interarrival times and exponential service times Ae i A i Se i S i

10
M/M/1 Queue M/M/1 Queue assumes exponential interarrival times and exponential service times Ae i A i Se i S i Exponential Review Expectations Memoryless Property Inverse Functions

11
M/M/1 Queue Relation to Poisson ifXtarrivals int()#(,] 0PXtPfirstarrivalt Pxt e t {()}{} {} 0
![M/M/1 Queue Relation to Poisson ifXtarrivals int()#(,] 0PXtPfirstarrivalt Pxt e t {()}{} {} 0](http://images.slideplayer.com/39/10945333/slides/slide_11.jpg "M/M/1 Queue Relation to Poisson ifXtarrivals int()#(,] 0PXtPfirstarrivalt Pxt e t {()}{} {} 0")
12
M/M/1 Queue Relation to Poisson PXtPfirstarrivalt Pxt e t {()}{} {} 0 PXtn te n nt {()} () ! miracle 37

13
M/M/1 Queue Inverse Function

14
M/M/1 Queue Inverse Function 2.032 1.951 1.349.795.539.347

15
M/M/1 Queue 2.032 1.951 1.349.795.539.347 0.305 0.074 0.035 0.520 1.535 0.159

16
M/M/1 Queue 2.032 1.951 1.349.795.539.347 0.305 0.074 0.035 0.520 1.535 0.159

17
M/M/1 Queue.347

18
M/M/1 Queue.347

19
M/M/1 Queue.539.347 0.305

20
M/M/1 Queue.5390.652

21
M/M/1 Queue.539 0.074 0.652

22
M/M/1 Queue 0.726

23
M/M/1 Queue.795 0.035 0.726

24
M/M/1 Queue 0..830

25
M/M/1 Queue 1.349 0.520 0.830

26
M/M/1 Queue 2.032 1.951 1.349.795.539.347 0.305 0.074 0.035 0.520 1.535 0.159

27
M/M/1 Event Calendar

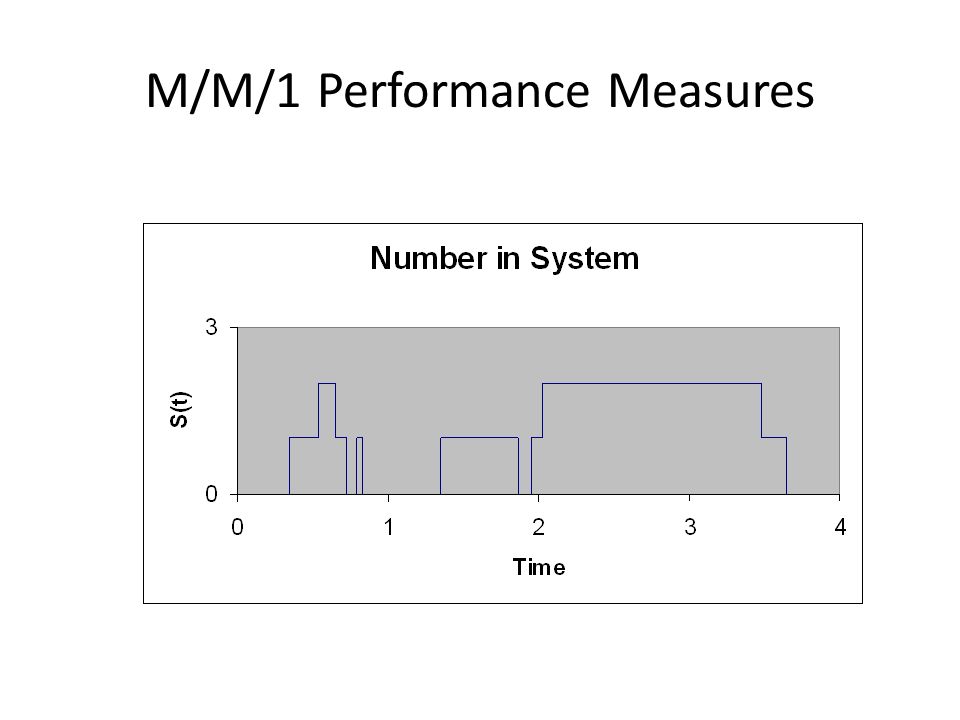
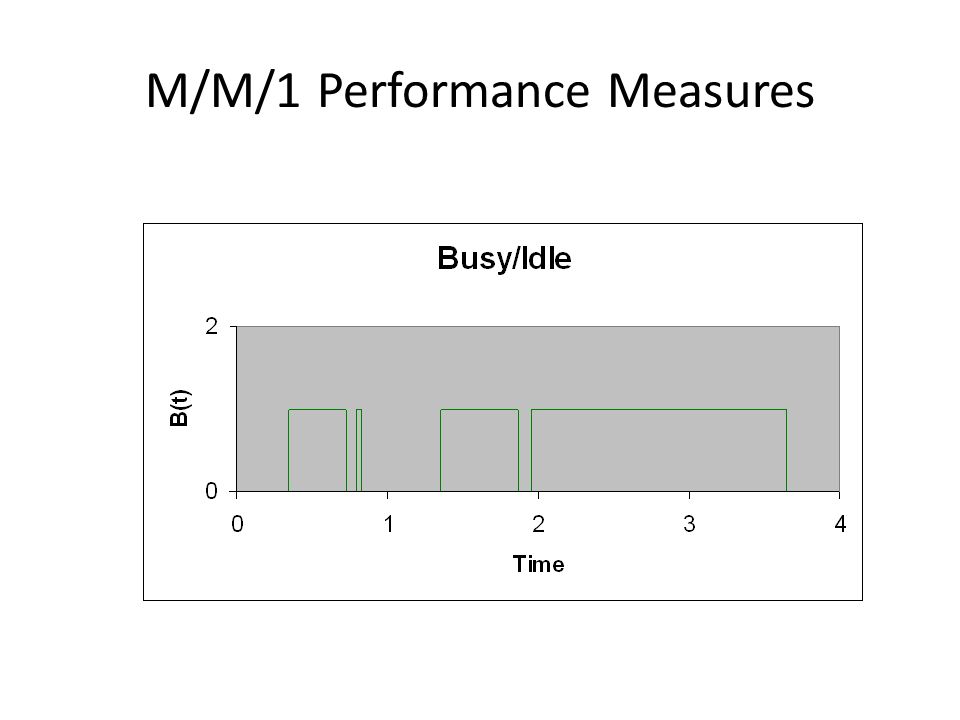
28
M/M/1 Performance Measures

Similar presentations

 Propagation (e.g., d/c) Retransmission (e.g., in ARQ)>")
 Cheng-Fu Chou.>")


 “We study the phenomena of standing, waiting, and serving, and we call this.>")


