Download presentation
Presentation is loading. Please wait.

1
ASSESSING THE IMPACT OF SOCIAL POLICIES ON HEALTH AND HEALTH INEQUALITIES: THEORY, METHODS, AND EVIDENCE Technical Meeting on Measuring & Monitoring Action on the Social Determinants of Health Arijit Nandi (arijit.nandi@mcgill.ca)arijit.nandi@mcgill.ca 20 June 2016 Department of Epidemiology, Biostatistics and Occupational Health Département d’épidémiologie, biostatistique et santé au travail

2
I. WHY EVALUATE?

3
3 Social factors and health: a conceptual model

4
What does the evidence tell us? Most studies concerning the social determinants of health are descriptive analyses that track the social patterning of health 1 Association ≠ causation (an association does not imply that intervening to change a social factor would alter the outcome) Comparatively few studies focus on understanding the causal effects of social exposures, such as education, on health Moreover, not all causal evidence is necessarily policy relevant, motivating calls for evaluation studies to prioritize the “assessment of the potential contribution to population health of particular interventions implemented” 2 4 1 Nandi and Harper (2014); 2 Galea (2013)
 Comparatively few studies focus on understanding the causal effects of social exposures, such as education, on health Moreover, not all causal evidence is necessarily policy relevant, motivating calls for evaluation studies to prioritize the assessment of the potential contribution to population health of particular interventions implemented Nandi and Harper (2014); 2 Galea (2013).")
5
What can we do about it?

6
... public health researchers should generate evidence that is closely aligned with what policy makers and program planners can use (O’Campo, 2012) Source: O’Campo, 2012
 Source: O’Campo,")
7
Evaluation promotes evidence-based public health Evidence-based public health calls for “a solid knowledge base on disease frequency and distribution, on the determinants and consequences of disease, and on the safety, efficacy, and effectiveness of interventions and their costs” 1 The results of a well-conducted impact evaluation study provides causal evidence on the effect of a particular program or policy and can help assess if the intervention was effective Undertaking “evaluation research to generate sound evidence [is] fundamental to achieving a more evidence-based approach to public health practice” 2 1 Victora (2004); 2 Brownson (2009)
![Evaluation promotes evidence-based public health Evidence-based public health calls for a solid knowledge base on disease frequency and distribution, on the determinants and consequences of disease, and on the safety, efficacy, and effectiveness of interventions and their costs 1 The results of a well-conducted impact evaluation study provides causal evidence on the effect of a particular program or policy and can help assess if the intervention was effective Undertaking evaluation research to generate sound evidence [is] fundamental to achieving a more evidence-based approach to public health practice 2 1 Victora (2004); 2 Brownson (2009)](http://images.slideplayer.com/39/10940258/slides/slide_7.jpg "Evaluation promotes evidence-based public health Evidence-based public health calls for a solid knowledge base on disease frequency and distribution, on the determinants and consequences of disease, and on the safety, efficacy, and effectiveness of interventions and their costs 1 The results of a well-conducted impact evaluation study provides causal evidence on the effect of a particular program or policy and can help assess if the intervention was effective Undertaking evaluation research to generate sound evidence [is] fundamental to achieving a more evidence-based approach to public health practice 2 1 Victora (2004); 2 Brownson (2009)")
8
II. WHAT IS IMPACT EVALUATION?

9
It’s evaluation for cause-and-effect questions Impact evaluation studies are among a range of complementary techniques for supporting evidence-based policymaking An impact evaluation “assesses the changes in the well-being of individuals that can be attributed to a particular project, program, or policy” 1, which we generally call interventions “Impact evaluation asks about the difference between what happened with the program and what would have happened without it (referred to as the counterfactual)…This difference is the impact of the program.” 2 1 Gertler (2011); 2 CGD (2006)
…This difference is the impact of the program. 2 1 Gertler (2011); 2 CGD (2006)")
10
What impact evaluation is not Some erroneously equate monitoring, health impact assessment, and impact evaluation Monitoring refers to “the process of collecting data and analyzing it to verify whether programs were implemented according to plan, whether financial resources and inputs were applied as intended, whether the expected outputs were realized, whether intended beneficiaries were reached, and whether time schedules were met.” 1 Health impact assessment: “A combination of procedures, methods and tools by which a policy, programme or project may be judged as to its potential effects on the health of the population, and the distribution of those effects” 2 1 CGD (2006); 2 WHO
; 2 WHO")
11
Potential outcomes framework What-if or counterfactual questions about the impact of an intervention are hypotheticals—so how can we answer them? The potential outcomes framework provides us with a guide for posing and answering counterfactual questions; it is the common language for impact evaluation in the social sciences The potential outcomes framework uses the specification of well-defined causal states to which all members of the population of interest could be exposed to identify what would have been under an alternative counterfactual scenario

12
True (unobserved) impact of an intervention Years (t) Outcome [E(Y i )] E(δ i )=E(y i 1 ) – E(y i 0 ) Counterfactual Intervention E(y i 1 ) E(y i 0 )
![True (unobserved) impact of an intervention Years (t) Outcome [E(Y i )] E(δ i )=E(y i 1 ) – E(y i 0 ) Counterfactual Intervention E(y i 1 ) E(y i 0 )](http://images.slideplayer.com/39/10940258/slides/slide_12.jpg "True (unobserved) impact of an intervention Years (t) Outcome [E(Y i )] E(δ i )=E(y i 1 ) – E(y i 0 ) Counterfactual Intervention E(y i 1 ) E(y i 0 )")
13
As with individuals, it is not possible to observe the same target population simultaneously under two different conditions Unlike their individual-level analogues, we can use our observed data to estimate E(y i ) and calculate a “naïve” estimate of the ATE Fundamental problem of causal inference
 and calculate a naïve estimate of the ATE Fundamental problem of causal inference")
14
As with individuals, it is not possible to observe the same target population simultaneously under two different conditions Unlike their individual-level analogues, we can use our observed data to estimate E(y i ) and calculate a “naïve” estimate of the ATE We could observe the same group at different time periods (pre- post), but other things may have changed since the intervention Fundamental problem of causal inference Causal effect? Years (t) Outcome [E(Y i )] Intervention E(y i |d i = 1, t+Δt) E(y i |d i = 0, t) Counterfactual
 Outcome [E(Y i )] Intervention E(y i |d i = 1, t+Δt) E(y i |d i = 0, t) Counterfactual.")
15
Fundamental problem of causal inference As with individuals, it is not possible to observe the same target population simultaneously under two different conditions Unlike their individual-level analogues, we can use our observed data to estimate E(y i ) and calculate a “naïve” estimate of the ATE We could observe the same group at different time periods (pre- post), but other things may have changed since the intervention Alternatively, we can observe a different group that was unexposed Causal effect? Years (t) Primary Outcome [E(Y i )] Intervention E(y i |d i = 1, t+Δt) E(y i |d i = 0, t+Δt) Counterfactual
 Primary Outcome [E(Y i )] Intervention E(y i |d i = 1, t+Δt) E(y i |d i = 0, t+Δt) Counterfactual.")
16
Fundamental problem of causal inference As with individuals, it is not possible to observe the same target population simultaneously under two different conditions Unlike their individual-level analogues, we can use our observed data to estimate E(y i ) and calculate a “naïve” estimate of the ATE We could observe the same group at different time periods (pre-post), but other things may have changed since the intervention Alternatively, we can observe a different group that was unexposed Either way, the substitutes were not reasonable counterfactuals The pre-post comparison ignores “secular trends” (changes in other factors influencing the outcome since the intervention) The comparison of exposed and unexposed neglects that exposed individuals generally differ from unexposed individuals
 and calculate a naïve estimate of the ATE We could observe the same group at different time periods (pre-post), but other things may have changed since the intervention Alternatively, we can observe a different group that was unexposed Either way, the substitutes were not reasonable counterfactuals The pre-post comparison ignores secular trends (changes in other factors influencing the outcome since the intervention) The comparison of exposed and unexposed neglects that exposed individuals generally differ from unexposed individuals")
17
III. HOW TO EVALUATE?

18
IDENTIFY “POLICY EXPERIMENTS”. Prioritizing specific policy reforms with the potential to affect major sources of global morbidity and mortality prioritized by the UN Development Goals SUPPORT EVIDENCE-BASED DECISION MAKING. Translating research findings for academic and non-academic audiences and identifying practical solutions for improving socioeconomic development and health Quasi-experiments. Estimating policy impact, and inequalities by gender, SES, and urban-rural residence FEEDBACK. Refining research priorities based on knowledge created and changing priorities of network partners Mediation analysis. Examining mechanisms through which policies influence health targets Cost-effectiveness. Comparing the costs and benefits of policies that have a robust effect on health EVALUATE.

19
Building data infrastructure

20
We collect longitudinal data on social policies related to poverty, income and gender inequality for all LMICs Breastfeeding breaks at work (1995-current)
")
21
21 Were breastfeeding breaks guaranteed at work? 1995 2014

22
Building data infrastructure We collect longitudinal data on social policies related to poverty, income and gender inequality for all LMICs Breastfeeding breaks at work (1995-current) Minimum wage (1999-current)
 Minimum wage (1999-current)")
23
How have minimum wages evolved over time?

24
Building data infrastructure We collect longitudinal data on social policies related to poverty, income and gender inequality for all LMICs Breastfeeding breaks at work (1995-current) Minimum wage (1999-current) Maternal and paternal leave policies (1995-current) Minimum age of marriage (1995-current) Family cash benefits (1999-current) Child labour (1995-current)
 Minimum wage (1999-current) Maternal and paternal leave policies (1995-current) Minimum age of marriage (1995-current) Family cash benefits (1999-current) Child labour (1995-current)")
25
Building data infrastructure We collect longitudinal data on social policies related to poverty, income and gender inequality for all LMICs Breastfeeding breaks at work (1995-current) Minimum wage (1999-current) Maternal and paternal leave policies (1995-current) Minimum age of marriage (1995-current) Family cash benefits (1999-current) Child labour (1995-current) Expanding to other public policy areas… Join policy data to survey data from harmonized DHS/MICS or other sources to create multilevel datasets
 Minimum wage (1999-current) Maternal and paternal leave policies (1995-current) Minimum age of marriage (1995-current) Family cash benefits (1999-current) Child labour (1995-current) Expanding to other public policy areas… Join policy data to survey data from harmonized DHS/MICS or other sources to create multilevel datasets")
26
Applying empirical methods Difference-in-differences (DD) can be used to compare the change over time in an outcome for a treatment group that experienced a reform vs. a control group that did not when a policy is adopted or modified in some areas but not others

28
Health behaviors (i.e., breastfeeding, vaccination) Child health Maternity leave Uptake of pre- & post-natal health services Prenatal maternity stress
 Child health Maternity leave Uptake of pre- & post-natal health services Prenatal maternity stress")
30
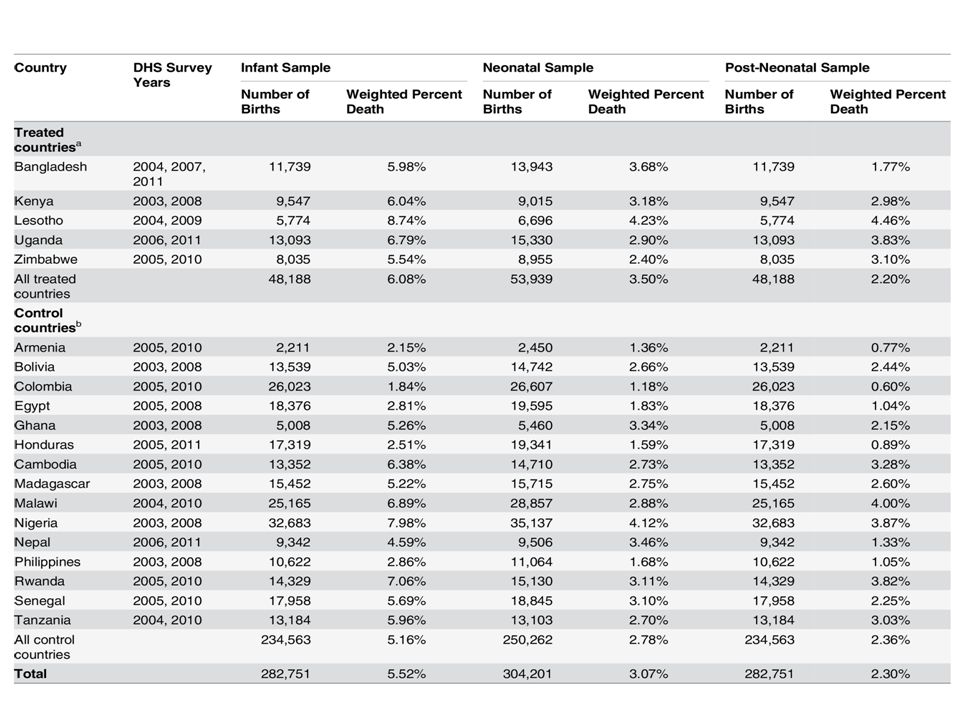
Increased leave lowered infant mortality Change in mortality/1000 live births for each month of paid leave* *results were robust to adjustment for individual, household, and country-level characteristics, including the wage replacement rate, GDP per capita, female labor force participation, government health expenditure per capita, and total health expenditure per capita

31
Applying empirical methods Difference-in-differences (DD) can be used to compare the change over time in an outcome for a treatment group that experienced a reform vs. a control group that did not when a policy is adopted or modified in some areas but not others Regression discontinuity (RD) methods can be used when eligibility for a particular program is determined by whether individuals are below or above a threshold value on a continuously measured variable, such as age or income
 methods can be used when eligibility for a particular program is determined by whether individuals are below or above a threshold value on a continuously measured variable, such as age or income.")
32
RD measures the difference in post-intervention outcomes between units near the cutoff—e.g., those units that were just above the threshold and did not receive cash payments serve as the counterfactual comparison group Source: Gertler (2011)
")
33
Future research directions Continuing to examine social policies that might influence health over the life-course, including early-life interventions Expanding to other public policy areas, including policies that can influence healthcare services, public health, social welfare, economic opportunity, gender equality, and the environment Assessing heterogeneous effects and impacts on social and gender inequalities in health Examining/monitoring implementation of policies and coverage of social determinants of health

34
Key collaborators: Efe Atabay, John Frank, Mohammad Hajizadeh, Sam Harper, Jody Heymann, Jay Kaufman, Lauren Maxwell, José Mendoza Rodriguez, Erin Strumpf, Ilona Vincent, and all of the research team Thanks! Partner institutions: Funding: For further information see www.machequity.comwww.machequity.com

Similar presentations


 2012 Module 6: Maternity leave and related types of leave Maternity.>")


 Cape Town, South Africa March 8 – 13, 2009 1 Causal Inference Nandini Krishnan Africa Impact Evaluation.>")