Download presentation
Presentation is loading. Please wait.

1
2014/15 INDUCTION WORKING GROUP REPORT APPENDIX SLIDES

2
-In total, approximately 200 first year students were involved in our audit of the induction. -It is important to note that the pie charts following this slide accommodate for 120 students who gave us their data, the remaining students were not willing, therefore the demographics displayed are not representative of every student who was involved. WHAT HAVE WE DONE?

3
DEMOGRAPHICS MALE 56 FEMALE 63 HOME 100 EU 8 INT’L 11

4
Accounting & Finance1 Management1 Sports Performance1 Sport & Exercise Science2 Pharmacology2 Physics2 Civil Eng2 Social Work2 IMML2 Childhood, Youth & Education2 Sports & Social Sciences3 Chemistry3 Architechture3 Computer Science3 Politics3 Mech Eng4 Natural Sciences4 Biochemistry5 Psychology5 MLES6 Pharmacy6 Biology7 Biomedical Sciences7 BBA8 Chem Eng9 Economics10 Maths13

5
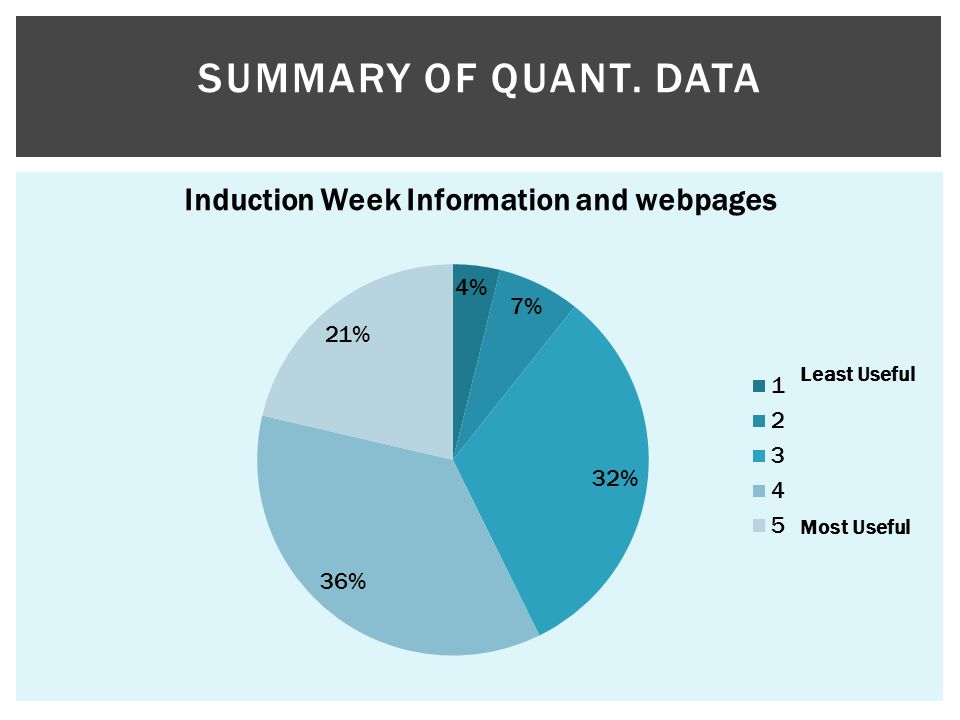
SUMMARY OF QUANT. DATA

7
Least Useful Most Useful

8
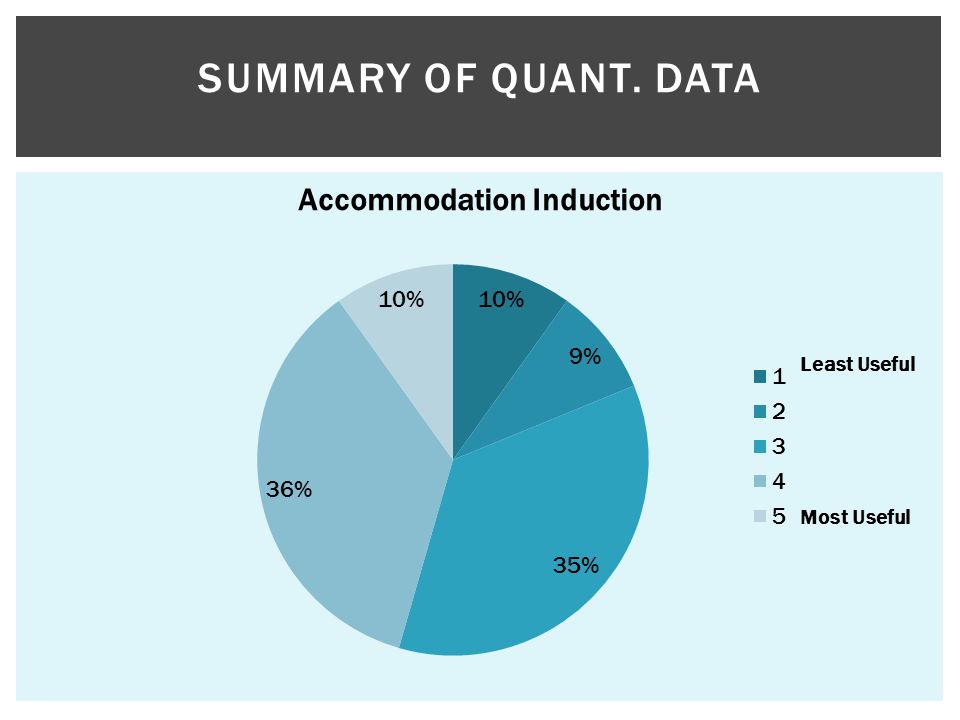
SUMMARY OF QUANT. DATA

9
Least Useful Most Useful

10
SUMMARY OF QUANT. DATA

Similar presentations


 ESSENTIAL ADVANCED LEVEL QUALIFICATIONS: Usually none although one or two universities require Mathematics.>")
 (£) Cumulative Fee (typical course)>")
 Dept CoC Division.>")


