Download presentation
Presentation is loading. Please wait.

1
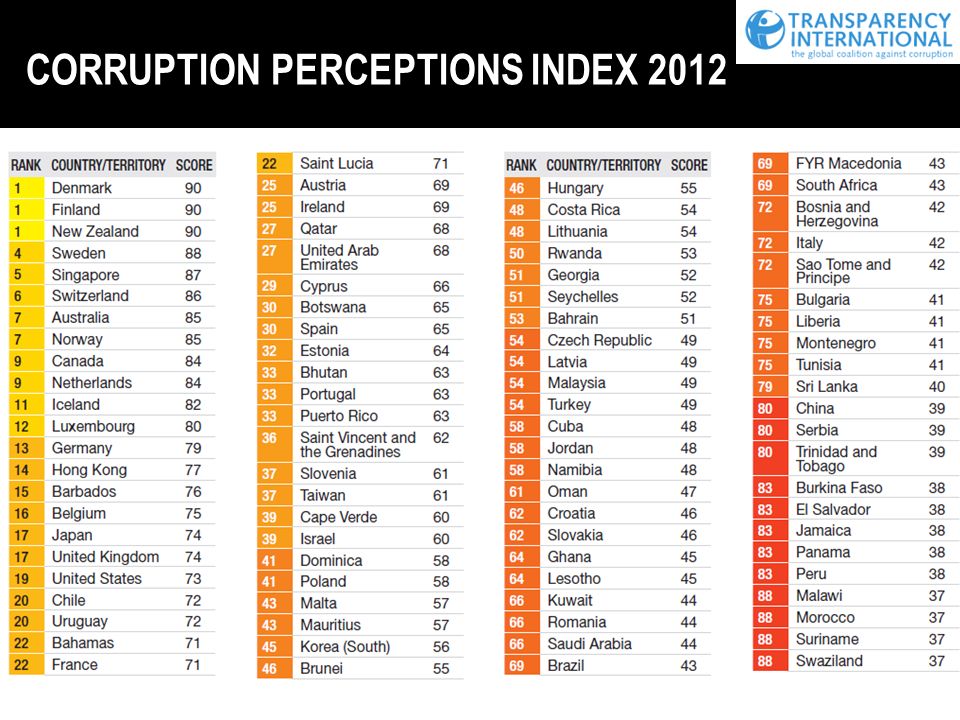
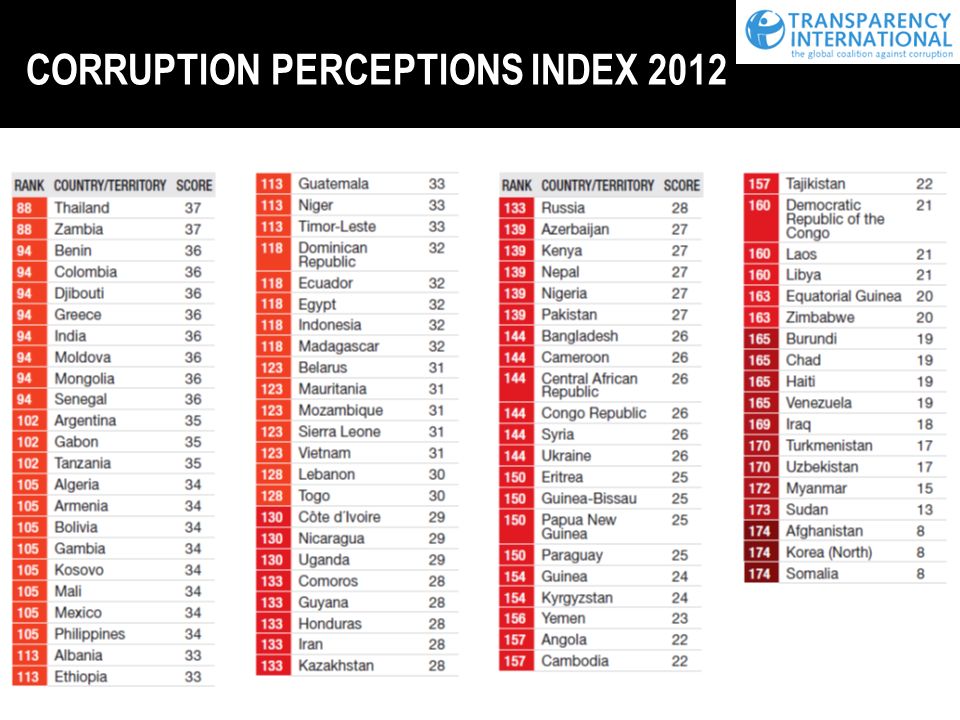
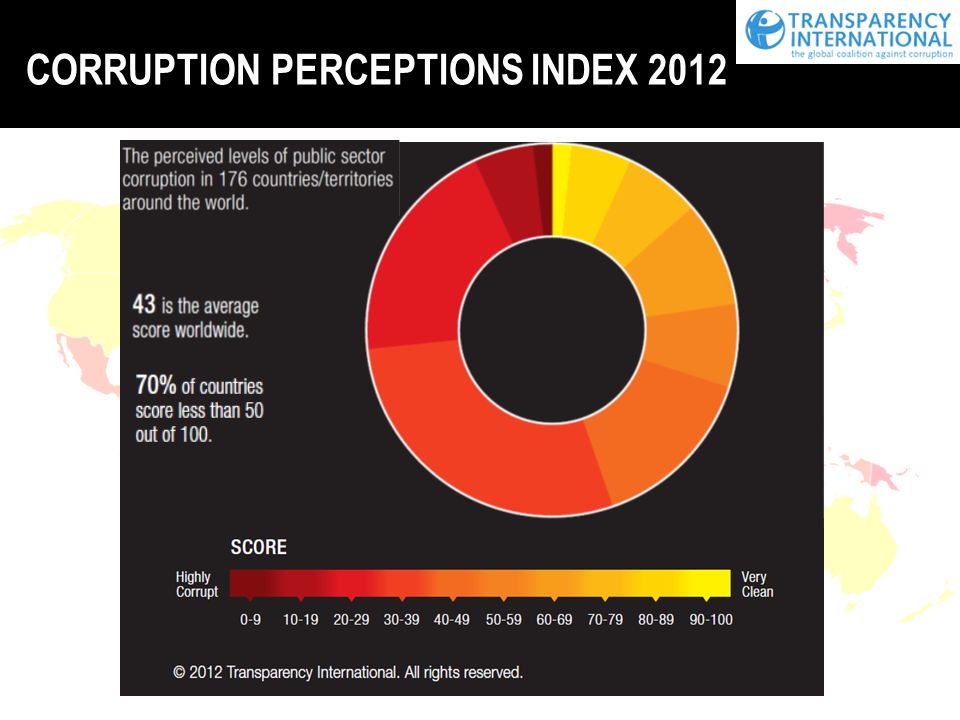
CORRUPTION PERCEPTIONS INDEX 2012 Published 5 th December 2012 Scores and ranks 176 countries and territories from around the world on the perceived level of corruption in the public sector.

2
THE CORRUPTION PERCEPTIONS INDEX IS: A global (176 countries/territories) aggregate Index (13 different data sources) capturing perceptions (experts/business people) of corruption (abuse of power for private gain) in the public sector (public officials and institutions)
 aggregate Index (13 different data sources) capturing perceptions (experts/business people) of corruption (abuse of power for private gain) in the public sector (public officials and institutions)")
3
Raise awareness at the global level Incentive for governments to improve Data contribution to analysis and research Cross country comparison of corruption risks in the public sector An entry point: Provides a broad national context from which to develop other research and studies to explore corruption issues in more detail, by region, sector, actor, channel etc THE CORRUPTION PERCEPTIONS INDEX DOES:

4
THE CORRUPTION PERCEPTIONS INDEX 2012 – HOW IT’S MADE Transparency International has updated the methodology for the Corruption Perceptions Index, allowing for year-over-year comparisons for all editions published from 2012 onward. From now on the Corruption Perceptions Index is presented on a scale from 0 (highly corrupt) to 100 (very clean).
 to 100 (very clean)..")
5
THE CORRUPTION PERCEPTIONS INDEX 2012 – HOW IT’S MADE STEP 1 – Select data sources STEP 2 – Rescale data sources STEP 3 – Calculate the average STEP 4 – Report uncertainty

6
STEP 1 – SELECT DATA SOURCES A) Measures perceptions of corruption in the public sector B) Reliable data from a credible institution C) Cross-country comparability D) Quantitative granularity E) Comparison over time What makes a valid data source:
 Measures perceptions of corruption in the public sector B) Reliable data from a credible institution C) Cross-country comparability D) Quantitative granularity E) Comparison over time What makes a valid data source:")
7
STEP 1 – SELECT DATA SOURCES 2012 DATA SOURCES: OrganisationData setCountry coverage 1. African Development BankGovernance Ratings 201153 African countries 2. Bertelsmann FoundationSustainable Governance Indicators 201131 OECD countries 3. Bertelsmann FoundationBertelsmann Transformation Index128 countries/territories 4. Economist Intelligence UnitCountry Risk Ratings144 countries/territories 5. Freedom HouseNations In Transit 201229 countries/territories 6. Global InsightCountry Risk Ratings203 countries/territories 7. IMDWorld Competitiveness Yearbook 201259 countries/territories 8. Political and Economic Risk Consultancy Asian Intelligence 201215 Asian countries/territories + US 9. Political Risk ServicesInternational Country Risk Guide140 countries/territories 10. Transparency InternationalBribe Payers Survey 201130 countries/territories 11. World BankCountry Policy and Institutional Assessment 2011 78 countries/territories 12. World Economic ForumExecutive Opinion Survey 2012140 countries/territories 13. World Justice ProjectRule of Law Index 201297 countries/territories

8
STEP 2 – RESCALE DATA SOURCES A)Reverse your data (if necessary) - Low number = Highly corrupt - High number = Very clean B)Standardise data to CPI scale (0-100) - Set average equal to 45 - Fix the spread of data to have a max 100, min 0 (standard deviation 20)
Reverse your data (if necessary) - Low number = Highly corrupt - High number = Very clean B)Standardise data to CPI scale (0-100) - Set average equal to 45 - Fix the spread of data to have a max 100, min 0 (standard deviation 20)")
9
STEP 2 – RESCALE DATA SOURCES

10
STEP 3 – CALCULATE THE AVERAGE At least three scores for each country Simple average of scores Each source counts equally (no weighting)
")
11
STEP 3 – CALCULATE THE AVERAGE DATA SOURCES AFDBBF (BTI) IMDICRGWEFWJPEIUGITIFH CPI SCORE BRAZIL583150354538523743 FYR MACEDONIA 49504821425043 SOUTH AFRICA 5545324143 54423643
 IMDICRGWEFWJPEIUGITIFH CPI SCORE BRAZIL FYR MACEDONIA SOUTH AFRICA")
12
STEP 4 – REPORT UNCERTAINTY To capture the uncertainty in the score Calculate a measure for the spread of the source data Using the rescaled scores from each data source for each country/territory Report the standard error Calculate a 90% confidence interval

13
STEP 4 – REPORT UNCERTAINTY SCORERANK# SURVEYS MINMAXSE90% CI (LOWER) 90% CI (UPPER) BRAZIL4369831583.33849 FYR MACEDONIA 4369621504.73551 SOUTH AFRICA 4369932552.53948
 90% CI (UPPER) BRAZIL FYR MACEDONIA SOUTH AFRICA")
14
CPI 2012: INSIDE THE SCORE DATA SOURCES AFDBBF (BTI) IMDICRGWEFWJPEIUGITIFH BRAZIL5831503545385237 FYR MACEDONIA 495048214250 SOUTH AFRICA 5545324143 544236 SCORERANK# SURVEYS MINMAXSE90% CI (LOWER) 90% CI (UPPER) BRAZIL4369831583.33849 FYR MACEDONIA 4369621504.73551 SOUTH AFRICA 4369932552.53948
 IMDICRGWEFWJPEIUGITIFH BRAZIL FYR MACEDONIA SOUTH AFRICA SCORERANK# SURVEYS MINMAXSE90% CI (LOWER) 90% CI (UPPER) BRAZIL FYR MACEDONIA SOUTH AFRICA")
15
CORRUPTION PERCEPTIONS INDEX 2012

19
CPI 2012: THE TOP RANKCOUNTRY/TERRITORYSCORE 1DENMARK90 1FINLAND90 1NEW ZEALAND90 4SWEDEN88 5SINGAPORE87 Denmark, Finland and New Zealand tie for first place with scores of 90, helped by strong access to information systems and rules governing the behaviour of those in public positions.

20
CPI 2012: THE BOTTOM RANKCOUNTRY/TERRITORYSCORE 172MYANMAR15 173SUDAN13 174AFGHANISTAN8 174KOREA (NORTH)8 174SOMALIA8 Afghanistan, North Korea and Somalia once again cling to the bottom rung of the index. In these countries the lack of leaders who are accountable and effective public institutions underscore the need to take a much stronger stance against corruption.

21
CPI 2012: THE BRICS RANKCOUNTRY/TERRITORYSCORE 69BRAZIL43 69SOUTH AFRICA43 80CHINA39 94INDIA36 133RUSSIA28 The major emerging markets all fall below the midpoint on the index, indicating the need to be vigilant of the corruption risks in these environments

22
COMPLEMENTING THE CPI % OF PEOPLE THAT HAVE PAID A BRIBE TO A PUBLIC SERVICE IN THE PAST 12 MONTHS (GLOBAL CORRUPTION BAROMETER, 2010) 4%21%56% % OF BUSINESS PEOPLE THAT THINK THAT THEY HAVE LOST BUSINESS BECAUSE A COMPETITOR PAID A BRIBE IN THE LAST 12 MONTHS (PUTTING CORRUPTION OUT OF BUSINESS, 2011) 34%-
 4%21%56% % OF BUSINESS PEOPLE THAT THINK THAT THEY HAVE LOST BUSINESS BECAUSE A COMPETITOR PAID A BRIBE IN THE LAST 12 MONTHS (PUTTING CORRUPTION OUT OF BUSINESS, 2011) 34%-")
23
COMPLEMENTING THE CPI

Similar presentations


 2013 summary report Model developed by the Economist Intelligence Unit (EIU)>")
 January 19 – 22, 2009 Tripoli, Libya.>")


