Download presentation
Presentation is loading. Please wait.

1
Yan Y. Kagan Dept. Earth and Space Sciences, UCLA, Los Angeles, CA 90095-1567, kagan@moho.ess.ucla.edu, http://eq.ess.ucla.edu/~kagan.htmlkagan@moho.ess.ucla.edu http://moho.ess.ucla.edu/~kagan/USC13.ppt Statistics of earthquake focal mechanisms

2
Outline of the Talk (1) Symmetry of Double-Couple earthquake source: DC4 – four rotations (fault-plane ambiguity); DC2 – two rotations (fault plane known); DC1 – one rotation. Statistical crystallographic texture studies: orientation, symmetry, Rodrigues space. Rotation theoretical probability distributions: Uniform, Cauchy, von Mises-Fisher. Statistical analysis of earthquake source properties in global seismicity. Kagan, Double-couple earthquake source: symmetry and rotation, GJI, 2013.

3
World seismicity: 1976 – 2012 (GCMT)
")
4
Schematic (beachball) diagram of the DC earthquake focal mechanism and its quadrupole radiation patterns. The null (B) axis is orthogonal to the T- and P-axes, or it is located on the intersection of fault and auxiliary planes, i.e., perpendicular to the paper sheet in this display. The N-axis is normal to the fault- plane; U is a slip vector.
 axis is orthogonal to the T- and P-axes, or it is located on the intersection of fault and auxiliary planes, i.e., perpendicular to the paper sheet in this display. The N-axis is normal to the fault- plane; U is a slip vector..")
5
Four schematic diagrams of earthquake focal mechanism with the DC4 symmetry. The right-hand coordinate system is used. We show how three vectors can be arranged in a standard representation of a 3-D Cartesian coordinate system.

7
Rodrigues transformation in crystallography

8
Fundamental zone display for DC4 source. The B, P, and T- axes of the source are shown. The octant of the cube 0 < x1 < 1; 0 < x2 < 1; 0 < x3 < 1; is called the `MacKenzie cell.' \

10
Fundamental zone display for DC4 source. Two opposite faces of the fundamental cube are shown. Colors show two face points corresponding to one source orientation with the angle Phi > 90 degree. The cyan central points correspond to two equivalent rotations Phi = 90. When rotation point moves to the edge of one face an equivalent point on the opposite face also moves to another edge, resulting in rotation with an angle 109.5 degrees.

11
DC4: Four sets for rotations with an angle 109.5 degrees.

12
DC4: Two sets of rotations with an angle 120 degrees.

14
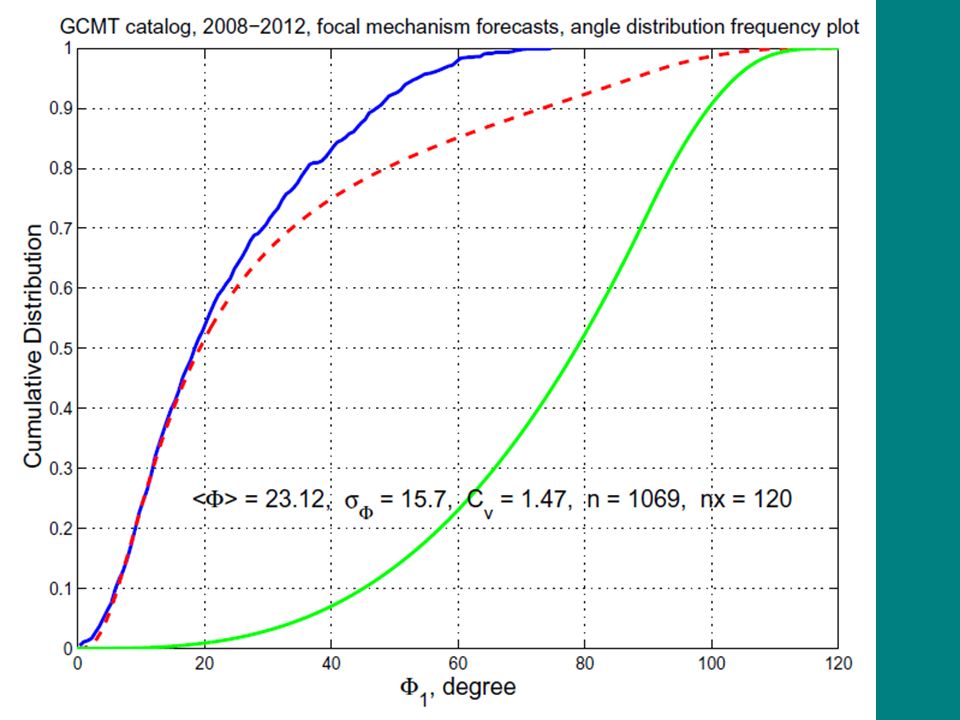
Cumulative distributions of rotation angles for pairs of focal mechanisms of shallow earthquakes in the GCMT catalog 1977-2011; Distance range 0-50 km, magnitude threshold 5.0, kappa=0.1.

15
Distance 400-500 km, kappa=0.2

16
Kappa = 0.075

19
Randomly rotated DC4 sources in the central section of the fundamental zone.

20
Shallow earthquakes, distance 0- 50 km, m>5.8. Shown in central section of the fundamental zone.

21
, The GCMT catalog 1977-2011. N is the total number of events with magnitude m >= m_t; N_p is the total number of event pairs; N_c is the number of event pairs in the central section; rho(pt, bp, bt) are the correlation coefficients for all points; rho’ is the correlation coefficient for all points within the central section; Phi is the average disorientation angle and its standard deviation.
 are the correlation coefficients for all points; rho’ is the correlation coefficient for all points within the central section; Phi is the average disorientation angle and its standard deviation..")
22
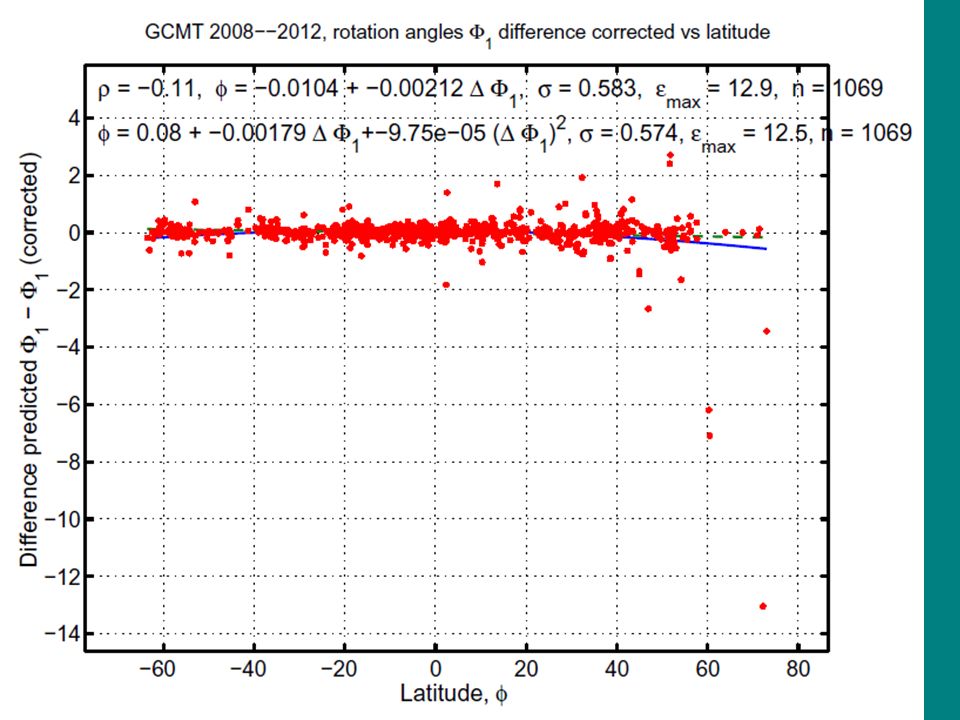
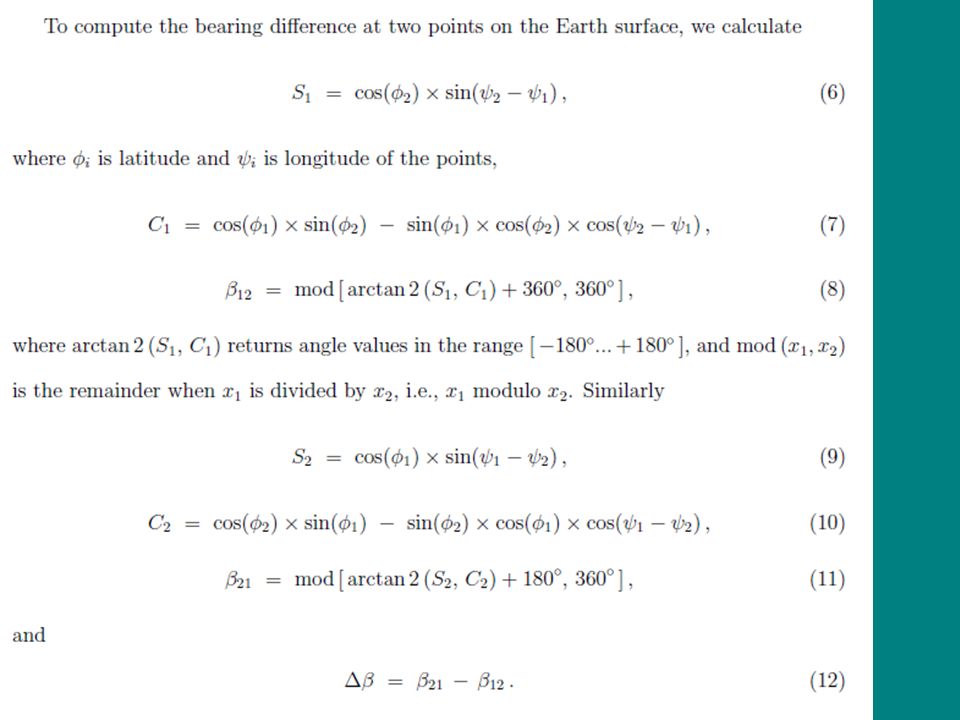
Outline of the Talk (2) Forecasts of focal mechanisms for future earthquakes (Kagan & Jackson, JGR, 1994): mechanisms and their uncertainty are forecasted. Because of spatial averaging the method does not work properly in polar areas. Difference in azimuth (bearing) needs to be taken into account in polar regions. We produce high-resolution forecast for the whole Earth, the forecast skill and source complexity is evaluated. Kagan & Jackson, Statistical earthquake focal mechanism forecasts, submitted to GJI.
 needs to be taken into account in polar regions. We produce high-resolution forecast for the whole Earth, the forecast skill and source complexity is evaluated. Kagan & Jackson, Statistical earthquake focal mechanism forecasts, submitted to GJI..")
23
World seismicity: 1976 – 2012 (GCMT)
")
25
Kagan & Jackson, GJI, 2000.

26
Forecast: Long-term earthquake rate based on GCMT catalog 1977-present. 0.1 x 0.1 degree, Magnitude M>=5.8

27
Focal mechanism forecast

43
END Thank you

45
Kagan, Y. Y., and D. D. Jackson, 1995. New seismic gap hypothesis: Five years after, J. Geophys. Res., 100, 3943-3959. N test (events number) L test (events location likelihood) R test (likelihood comparison of models)
 L test (events location likelihood) R test (likelihood comparison of models).")
46
Jackson, D. D., and Y. Y. Kagan, 1999. Testable earthquake forecasts for 1999, Seism. Res. Lett., 70, 393-403. Combined long- and short-term forecast for north- and south- western Pacific area

47
Global earthquake long-term potential based on smoothed seismicity

48
Forecast: Short-term earthquake rate based on GCMT catalog 1977- present. 0.1 x 0.1 degree, Magnitude M>=5.8

49
http://bemlar.ism.ac.jp/wiki/index.php/Bird%27s_Zones

Similar presentations


>")


 Yan Y. Kagan Department of Earth and Space Sciences, University of.>")


 model Seismicity rate = background + aftershocks: Magnitude distribution: uniform G.R. law with b=1 (Fig.>")