Download presentation
Presentation is loading. Please wait.

1
DEVELOPING A STATUS REPORT: A HYPOTHETICAL EXAMPLE Tong Wang P463-468, Chapter 13 Process and performance Measurement and Evaluation, Project Management Fifth Edition, McGraw-Hill 2011.

2
Assumptions Assume each cost account has only one work package, and each cost account will be represented as an activity in the network. The project network EST will serve as the basis for assigning the baseline values. From the moment work on a activity begins, some actual costs will be incurred each period until the activity is completed. How to add cost factor to network

4
Baseline Development From the figure13.6, there are six deliverables in the project and five departments in the firm. Plan Value (cost account) = $320,000. From the Gantt chart (Figure 13.7), we can write down the network chart. And we can find this planning schedule is according to the early start time planning. 11 here is the minimum duration of the critical path.
 = $320,000. From the Gantt chart (Figure 13.7), we can write down the network chart. And we can find this planning schedule is according to the early start time planning. 11 here is the minimum duration of the critical path..")
5
Baseline Development AC B D E F end start 911 9 69 69 26 26 25 36 24 46 02 02

6
Baseline Development For example activity A, Design and Specifications, is planned to finish by Department of Design to finish in the first two weeks with the cost of $20,000. So activity (PV, DUR, ES, LF, SL) is known now. (Schedule information of figure 13.8)
 is known now. (Schedule information of figure 13.8).")
7
Baseline Development Another kind of information we need is Baseline budget needs in each time period with this early start Baseline. (Baseline Budget of Figure 13.8) They are assigned as managers plan to monitor and measure schedule and cost performance.
 They are assigned as managers plan to monitor and measure schedule and cost performance..")
9
Development of Status Report Work packages are in one of three conditions on a report date (Not-started, Finished, In-process). We use EV to measure schedule and cost performance.

10
Development of Status Report EV= Total PV *percentage of complement budgeted cost of work performed CV=EV-AC(cumulative cost) Budgeted cost minus actual cost with the same work performance. SV=EV-PV (cumulative cost) Work performed minus work scheduled with the same cost, not the same time. It is possible to have negative SV, when the activity in ahead on the critical path.
 Work performed minus work scheduled with the same cost, not the same time. It is possible to have negative SV, when the activity in ahead on the critical path..")
12
Development of Status Report For each period, we can calculate the EV, CV, and SV. (Table 13.2) By period 7, Tasks A, B, D are finished, but all are over budget. Task C is 90% complete. Task E is late and hasn’t started because Task C is delayed. At the end of period 7, the project is over budget $70,000 (CV=-70), with a schedule budget over $40,000 (SV=-40).
 By period 7, Tasks A, B, D are finished, but all are over budget. Task C is 90% complete. Task E is late and hasn’t started because Task C is delayed. At the end of period 7, the project is over budget $70,000 (CV=-70), with a schedule budget over $40,000 (SV=-40)..")
13
Development of Status Report Next we should give the Tracking Gantt bar Chart, which could give accurate assessment of schedule performance. (Figure 13.10) Activity B, C, and D are delayed. The delay of 2weeks of Task C will delay Tasks E and F, and result in the project being late in 2 weeks.
 Activity B, C, and D are delayed. The delay of 2weeks of Task C will delay Tasks E and F, and result in the project being late in 2 weeks..")
15
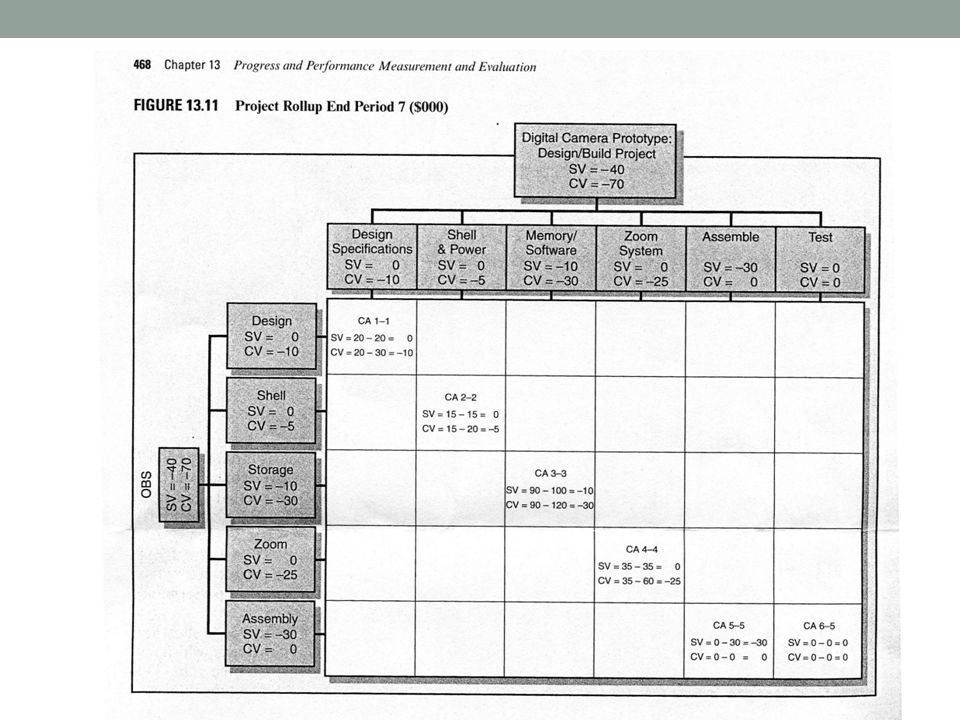
Development of Status Report We could also give a project rollup at the end of period 7 by deliverables and organization unites.(Figure 13.11) Each responsible department should give an explanation for these variances.
 Each responsible department should give an explanation for these variances.")
17
Summary 1. Assumption 2. Baseline Development Scheduling Planed Value 3. Status Report Actual Cost, Percentage of Complement, Earned Value, Schedule Variance, Cost Variance Gantt Bar Chart Project Rollup

Similar presentations


>")


. Project Management.>")


