Download presentation
Presentation is loading. Please wait.

1
Has Comprehensive Performance Assessment been a significant catalyst for improvement in Public Services in England? A case study of the benefits administration service in local government Murphy, P. Greenhalgh, K. and Jones, M. Nottingham Business School Nottingham Trent University

2
Background Benefits Administration – 2 principal distributors Local Government – Council Tax and Housing Benefit Central Government – Unemployment, State Pension Child Benefit etc Council Tax Benefit and Housing Benefit Universal system administered on behalf of central government Unitary and District Councils administer system in England HB – 4.5m people @ £80 per week approximately 180m p.a. CTB 5.5m households @ £15pw approx £40m so £220m p.a. Management or Administrative Framework New verification framework introduced in 2002 Performance Management and Assurance through the Comprehensive Performance Assessments (CPA) introduced April 2002
 introduced April")
3
Existing Literature and Research Research is primarily operational, short term and partial research – mostly sponsored by the government or by the Audit Commission – commentators have pointed out that both have vested interests Little academic literature devoted to assessing how either the system as a whole has performed or to which parts of the system have been the most effective in driving up improvements to public services One difficulty has often been the changing data bases, changing assessment criteria and changing definitions – and of course we are dealing with a politically contested public service Academics as well as local and central politicians increasingly questioning the effectiveness of CPA as they develop and promote CAA

4
Why Benefits Administration and why this Performance Indicator? Benefit Administration - Huge amount of public resources to both run the system and to distribute through the system – will increase with the recession PI - The definition, the means of collection, and its public reporting remained the same throughout the study period – It is secondary data but it is verified, publically available “good” secondary data The use and importance of this particular PI was (almost uniquely) never challenged by local authorities, the auditors, the inspectors or the government in fact it was often used as the key proxy indicator for the performance of the service as a whole The indicator existed and was collected nationally both prior to the CPA regime and is still being universally collected after CPA as part of the new DWP “ Right Time Indicator”.
 never challenged by local authorities, the auditors, the inspectors or the government in fact it was often used as the key proxy indicator for the performance of the service as a whole The indicator existed and was collected nationally both prior to the CPA regime and is still being universally collected after CPA as part of the new DWP Right Time Indicator ..")
5
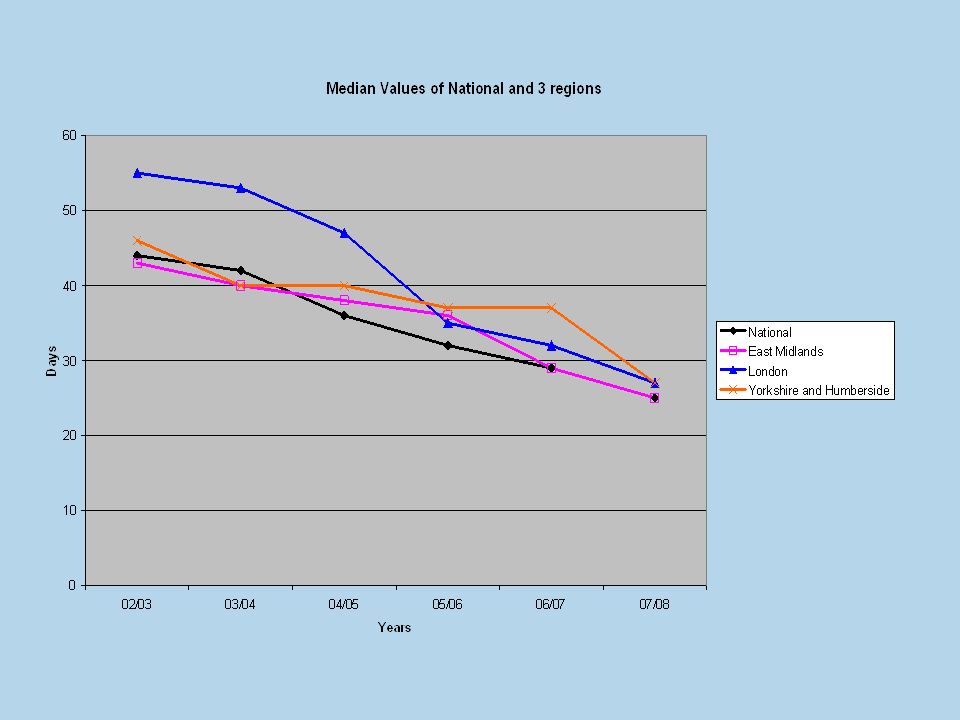
What did we look at? The national performance in England between 2002-2008, the period of CPA, and briefly looked at previous performance Due to the number of local authorities administering the system changing from 388 and 323 (due to local government reorganisation) we looked in more detail at the performance of authorities in the three regions not affected by these changes - East Midlands, London and Yorkshire and Humberside Potential changes to the inputs of the system - money people and technology Political influence or control of authorities Whether “size matters” in this case Whether “geography matters” - any difference in urban or rural performance
 we looked in more detail at the performance of authorities in the three regions not affected by these changes - East Midlands, London and Yorkshire and Humberside Potential changes to the inputs of the system - money people and technology Political influence or control of authorities Whether size matters in this case Whether geography matters - any difference in urban or rural performance.")
8
02/0303/0404/0505/0606/0707/08 East Riding of Yorkshire27 23201918 Kingston upon Hull, City of433662252420 North East Lincolnshire564236352317 North Lincolnshire342427323329 York58.73403429 North Yorkshire Craven587433282019 Hambleton536242292420 Harrogate48 42352927 Richmondshire372314182334 Ryedale443538293027 Scarborough434847282519 Selby604044252221 South Yorkshire Barnsley687442363123 Doncaster373526302523 Rotherham31 2827 26 Sheffield464941375537 West Yorkshire Bradford3637362431 Calderdale754738 2629 Kirklees135604030 Leeds413379443128 Wakefield6982504127 Grade 4Less than 30 days Grade 330-36 days Grade 236-48 days Grade 1over 48 days Yorkshire and Humberside

9
02/0303/0404/0505/0606/0707/08 Camden485560413223 London (City of )2526343023 Hammersmith and Fulham685659452825 Kensington and Chelsea463332293227 Wandsworth686957423933 Westminster746177444034 Hackney151141117552621 Haringey545047424035 Islington978257362826 Lambeth1331018953.27 Lewisham394036313826 Newham623854414736 Southwark503439413439 Tower Hamlets474252332825 Barking and Dagenham46 68413023 Bexley504636353128 Enfield674944313428 Greenwich455038293133 Havering577440312725 Redbridge493938313237 Waltham Forest697855262421 Bromley88664233 29 Croydon416238272823 Kingston upon Thames685647393327 Merton566048202536 Sutton545342312724 Barnet555339387728 Brent865648363526 Ealing804844517045 Harrow877827232120 Hillingdon425759262224 Hounslow494647453943 Richmond upon Thames303149312719 Grade 4Less than 30 days Grade 330-36 days Grade 236-48 days Grade 1over 48 days London
 Hammersmith and Fulham Kensington and Chelsea Wandsworth Westminster Hackney Haringey Islington Lambeth Lewisham Newham Southwark Tower Hamlets Barking and Dagenham Bexley Enfield Greenwich Havering Redbridge Waltham Forest Bromley Croydon Kingston upon Thames Merton Sutton Barnet Brent Ealing Harrow Hillingdon Hounslow Richmond upon Thames Grade 4Less than 30 days Grade days Grade days Grade 1over 48 days London")
10
02/0303/0404/0505/0606/0707/08 Derby795549395836 Leicester14111169575932 Nottingham1206335282928 Rutland423957252421 Derbyshire Amber Valley426754402732 Bolsover202238472819 Chesterfield26 32332927 Derbyshire Dales252328312617 Erewash837035402927 High Peak2122 172021 North East Derbyshire485749322823 South Derbyshire1415 252928 Leicestershire Blaby49 3539 31 Charnwood353231303127 Harborough323933423530 Hinckley and Bosworth434137512621 Melton55434427 32 North West Leicestershire1925 383124 Oadby and Wigston344529514031 Lincolnshire Boston433757416024 East Lindsey353938412516 Lincoln543339333428 North Kesteven353738242919 South Holland303136322928 South Kesteven464542353328 West Lindsey454639 3423 Northamptonshire Corby505148402719 Daventry2930 344225 East Northamptonshire293524 3028 Kettering755231393132 Northampton968263613724 South Northamptonshire5399105352422 Wellingborough443541363027 Nottinghamshire Ashfield543839373132 Bassetlaw434750292723 Broxtowe506945503128 Gedling454437423223 Mansfield363433292725 Newark and Sherwood344031443523 Rushcliffe3126 322821 Grade 4Less than 30 days Grade 330-36 days Grade 236-48 days Grade 1over 48 days East Midlands

11
Political Control

14
The inputs and outputs of the CTB/HB system Inputs Client Applications Information from 3 rd Parties (Job Centre Plus, Citizens Advice) Staff and Managerial resources Processes Information technology, systems and processes Prioritisation and Decision making HB and CTB processes Performance Measurement BVPIs CPA Score Outcomes Impact on beneficiaries Income Re - distribution Outputs Payment of CTB and HB Performance Information
 Staff and Managerial resources Processes Information technology, systems and processes Prioritisation and Decision making HB and CTB processes Performance Measurement BVPIs CPA Score Outcomes Impact on beneficiaries Income Re - distribution Outputs Payment of CTB and HB Performance Information")
15
Conclusions and Recommendations Huge sustained improvement throughout the country across years, types of authority, political control and in different communities Politicians became increasingly pre-occupied with outcomes and targets but improvements in inputs and outputs are as important to managers and benefit claimants Improvements of this scale cannot be explained by increases in finance, technology or human resources Research demonstrates the importance of system and process improvement and of an holistic systemic approach to public services CPA acted as the catalyst for the overwhelming part of this improvement

16
Coercive Isomorphism and Rational Choice Theory Coercive Institutionalism Isomorphism “pressures to make organizational procedures and/or structure conform to best practices, arising from the demands of actors on whom the organization is dependent for resources (the ‘resources dependence model’ associated with Pfeffer and Salancik, 1978) or even from outright regulation and mandates” http://faculty.chass.ncsu.edu/garson/PA765/institutionalism.htm Rational Choice Theory Analysis based on assumptions that decision makers are rational, self-interested optimisers. Local authorities complied with CPA and the social bargain (or reward) was increased financial rewards together with freedoms and flexibilities from Central Government control. (the Central Government assumption). http://faculty.chass.ncsu.edu/garson/PA765/institutionalism.htm
 was increased financial rewards together with freedoms and flexibilities from Central Government control. (the Central Government assumption).")
17
Areas or questions for further research What has happened since 2008? Does the performance of services shown by other Performance Indicators in the LA benefit administration framework support these findings Do other performance assessments most notably external benefit service inspections in the LA benefit administration performance framework support our findings Scotland Wales and N. Ireland have same benefits but different performance management arrangements – so we can compare performance to see if it was optimised Compare performance with performance in Central Government administered benefits services Can we compare performance with that in other countries

18
Contact Details Pete Murphy: Peter.Murphy@ntu.ac.ukPeter.Murphy@ntu.ac.uk 0115 8488092 Kirsten Greenhalgh Kirsten.Greenhalgh@ntu.ac.ukKirsten.Greenhalgh@ntu.ac.uk 0115 8488017 Martin Jones Martin.Jones@ntu.ac.ukMartin.Jones@ntu.ac.uk 0115 8488696

Similar presentations