Download presentation
Presentation is loading. Please wait.

1
Maxwell-Boltzmann Distribution Curves Mrs. Kay Chem 12 A

2
In a sample gas or liquid, the molecules are in constant motion and collision. When they do this, no energy is lost from the system - they’re elastic collisions. Each molecule varies in its own energy, some have more, some less.

3
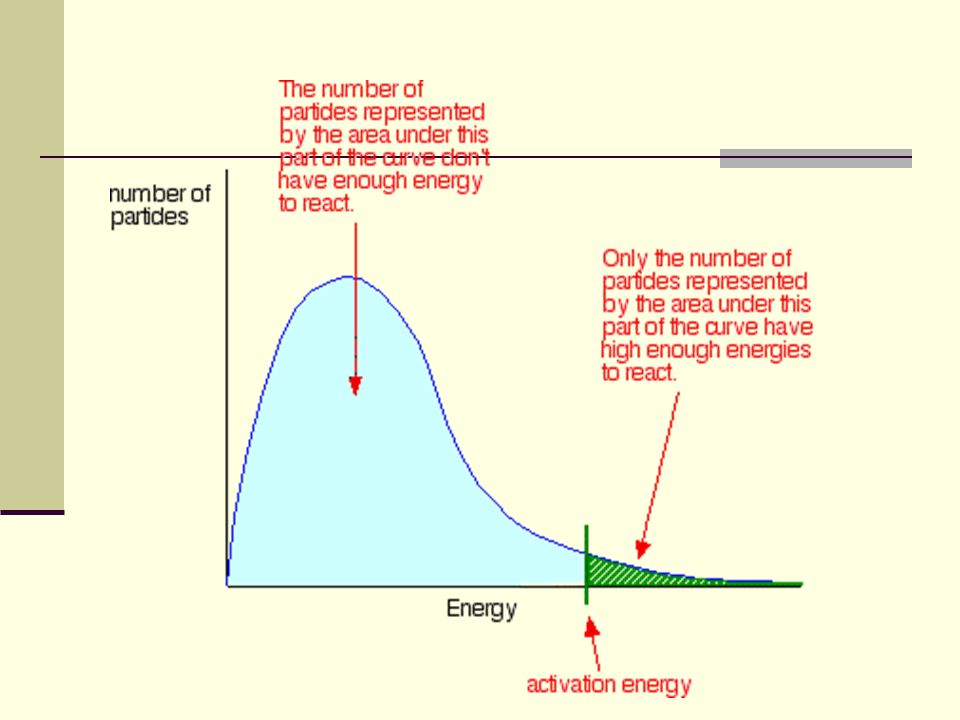
A Maxwell-Boltzmann distribution curve/graph shows how the energy was spread out over different molecules

4
Remember… the area under the curve = the total molecules in the sample, and it doesn’t change All molecules have energy Few molecules have high energies, but there is no maximum energy for a molecule.

5
If you increase the temperature of the sample, the distribution becomes stretched out and has a lower peak, but the area under the curve remains the same.

7
To speed up the reaction, you need to increase the number of the very energetic particles - those with energies equal to or greater than the activation energy. Increasing the temperature has exactly that effect - it changes the shape of the graph. / Energy

8
Molecularity and Rate Law

9
Molecularity The number of molecules that participate as reactants in an elementary step Unimolecular: a single molecule is involved. Ex: CH 3 NC (can be rearranged) Bimolecular: Involves the collision of two molecules NO + O 3 NO 2 + O 2 Termolecular: simultaneous collision of three molecules. Far less probable.
 Bimolecular: Involves the collision of two molecules NO + O 3 NO 2 + O 2 Termolecular: simultaneous collision of three molecules. Far less probable..")
10
Rate Law Math expression to show how rate depends on concentration Rate = k[reactant 1] m [reactant 2] n … m and n are called reaction orders. Their sum is called the overall reaction order. k is the rate constant. It is specific to a reaction at a certain temperature. The value of the exponents are determined experimentally, we cannot use stoichiometry!
![Rate Law Math expression to show how rate depends on concentration Rate = k[reactant 1] m [reactant 2] n … m and n are called reaction orders.](http://images.slideplayer.com/39/10900327/slides/slide_10.jpg "Their sum is called the overall reaction order. k is the rate constant. It is specific to a reaction at a certain temperature. The value of the exponents are determined experimentally, we cannot use stoichiometry!.")
11
Sample Exercise 1: 2NO + 2H 2 N 2 + 2H 2 O is the reaction we’re studying, this is the data found during our experimentation Experiment Number Conc. of NO (M) Conc. of H 2 (M) Rate of N 2 forming (M/s) 10.2100.1220.0339 20.2100.2440.0678 3 0.4200.1220.1356
 Conc. of H 2 (M) Rate of N 2 forming (M/s)")
12
Study the data Exp #1 and #2, [NO] is unchanged, [H 2 ] is doubled and this causes the rate to double (0.0678/0.0339 =2), the H 2 ’s rate order is 1. Exp #1 and #3, [H 2 ] is unchanged, [NO] is doubled and this causes the rate to quadruple (0.1356/0.0339 =4), NO’s rate order is 2. Rate = k [NO] 2 [H 2 ] The overall rate order for this reaction is 3 (1+2)
![Study the data Exp #1 and #2, [NO] is unchanged, [H 2 ] is doubled and this causes the rate to double (0.0678/ =2), the H 2 ’s rate order is 1.](http://images.slideplayer.com/39/10900327/slides/slide_12.jpg "Exp #1 and #3, [H 2 ] is unchanged, [NO] is doubled and this causes the rate to quadruple (0.1356/ =4), NO’s rate order is 2. Rate = k [NO] 2 [H 2 ] The overall rate order for this reaction is 3 (1+2).")
13
Suppose… If when we ran exp #1 and #3, the rate didn’t change, what rate law would we expect? Since it didn’t change when we doubled [NO], the rate order is 0, meaning the rate doesn’t depend on the concentration of NO at all, so rate= k[H 2 ] and the overall reaction order is 1.

14
Sample Exercise 2: Use the kinetics data to write the rate law for the reaction. What overall reaction order is this? 2NO + O 2 2NO 2 Exp #[NO][O 2 ]Rate forming NO 2 (M/s) 10.015 0.048 20.0300.0150.192 30.0150.0300.096 40.030 0.384
")
15
Sample Exercise 3 Rate data for the reaction: CH 3 Br + OH - CH 3 OH + Br - Exp #CH 3 BrOH - Rate of forming CH 3 OH 10.200 0.015 20.4000.2000.030 30.400 0.060 Use the data to find the experimental rate law.

Similar presentations