Download presentation
Presentation is loading. Please wait.

1
Arbor Lake Water Quality External & Internal Nutrient Loading

2
IOWATER Monitoring Sites This map shows the locations and names of sites being monitored by IOWATER volunteers. Water samples have been analyzed monthly from the principal inlets and the one outlet since October of 2003. Hazel Creek & Wood Creek enter the lake’s north end while Hobo Drain & Hobo Creek enter the east arm of the lake.

4
External Phosphorus Loading Phosphorus concentrations (mg/L) are shown for each of the principal inlets and the single outlet. The total range is shown by the vertical bar and the 25th and 75th percentiles are represented by the box.

6
Weighted Avg. Phosphorus Load Table I shows the average Phosphorus concentrations and average flow rates of the principal inlets and the single outlet. From this, a weighted average percent P. load can be computed for each inlet, and the sum of the inlets can then be compared with the outlet. Five times as much Phosphorus enters the lake as exits the lake.

7
Table I - External Phosphorus Load StreamsAv. P. (mg/L) Av. Flow (L/sec) % Total Flow Wtd.Av.P( mg/L) Hazel Cr..1616.745.072 Wood Cr..816.217.138 Hobo Dr..922.67.064 Hobo Cr..609.626.156 Gully.091.75.005 Total Inflow.51636.8100.4345 Spillway.0837.1100.08
 % Total Flow Wtd.Av.P( mg/L) Hazel Cr Wood Cr Hobo Dr Hobo Cr Gully Total Inflow Spillway")
8
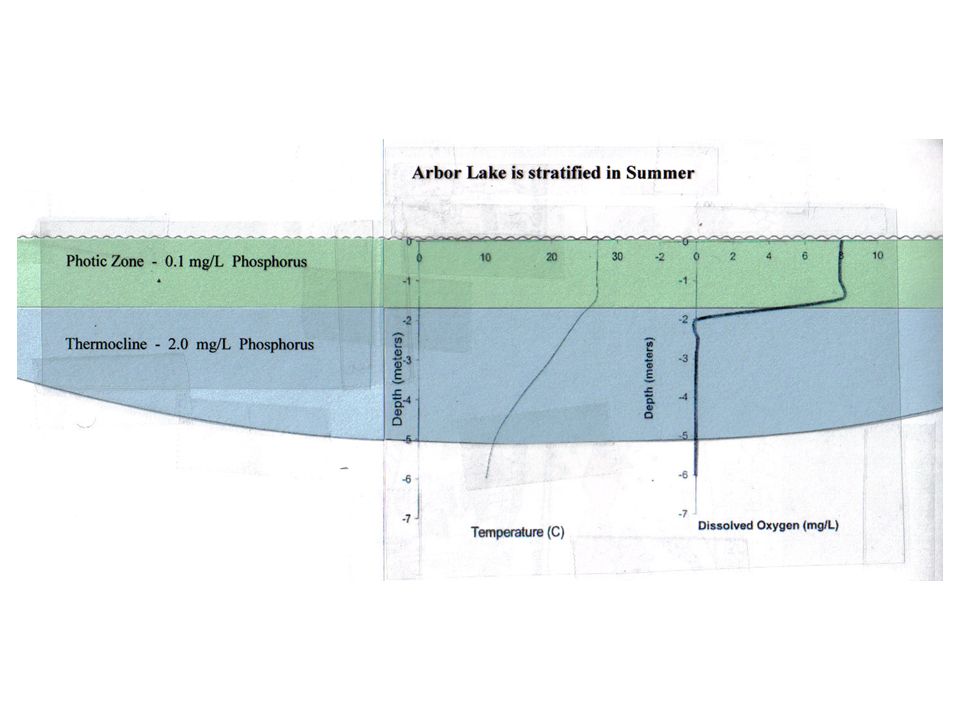
Lake Stratification In Summer the lake is stratified into a mixed layer of warm water on top of a cooler layer with a thermal gradient. Algal blooms in the photic zone deplete dissolved nutrients. Algae die and sink into the thermocline where bacterial decomposition releases nutrients and depletes oxygen. The result is a concentration of Phosphorus in the lower stratum of the lake.

10
Deep Sampling In the summer of 2006 the deeper part of the lake was sampled using a 10 ft. length of PVC pipe inserted through a styrofoam buoy and tethered to a canoe. Water was withdrawn from the pipe using a vacuum pump designed to siphon gas from the tank of a car. The volume of the pipe was computed to be 0.6 Liter. Several volumes were removed prior to taking the sample. The resulting data confirms that nutrient enrichment accompanies oxygen depletion in a stratified lake.

12
Lake Volumes The hypsograph is derived from the bathymetric map and is used to compute volumes shown in Table II. 75% of the lake volume lies above 2.5 meters depth.

15
Table II – Lake Volume Depth (m) Area (%) Area (Ac) Area (Sq. M) Vol(Cu. M.) Cum. Vol. 0-.5.9613.445439127196.5-1.5.9212.8852206 79402 1.5-2.5.577.9832295 111697 2.5-3.5.314.3417564 129261 3.5-4.5.192.6610765 140026 4.5-5.5.081.124533 144559
 Vol(Cu. M.) Cum. Vol")
Similar presentations


? What are the WLA assumptions? How will Avista’s.>")
. Advantages:Simplicity simple to construct simple to construct simple to operate and maintain simple to operate and.>")
 Length of Tributary Streams - 264 miles Residential.>")


 of phytoplankton can be measured directly by O.>")
 A Clean-In-Place system is used to direct sanitizer from a reservoir to a recently cleaned milk tank. The sanitizer exists.>")

 EarthsClimate_Web_Chapter.pdfEarthsClimate_Web_Chapter.pdf, p. 22-24.>")
