Download presentation
Presentation is loading. Please wait.

1
M. Roberts, P. L. Vidale, D. Stevens, Ian Stevens, Len Shaffrey, UJCC team with help from many others at Met Office and NCAS-Climate and CCSR/NIES/FRCGC ENSO and other processes in a matrix of coupled climate models at different resolutions

2
© Crown copyright Met Office Overview of ENSO ENSO is the first mode of global surface temperature variability on interannual timescales ENSO teleconnections produce significant impacts on climate in highly populated regions Important for seasonal/interannual climate variability and extremes Vital for regional impacts The spatial and temporal structure of ENSO variability is now described for HadGEM1.1 and HiGEM1.1 models.

3
Nino3 SST non-normalised power spectrum for Had/HiGEM 1.1&2

4
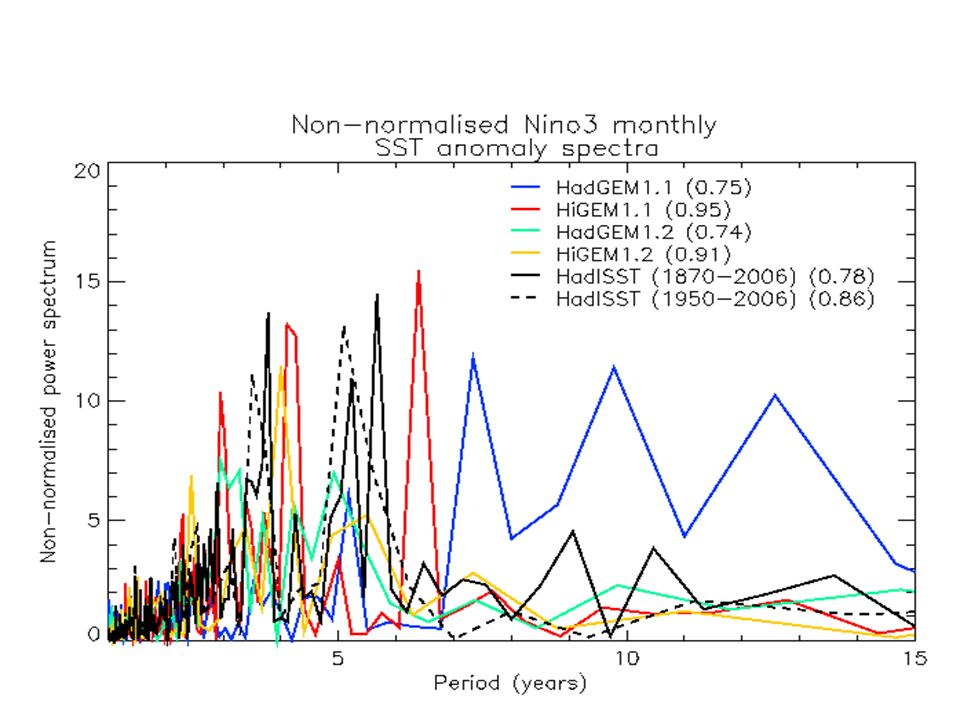
Nino3 SST non-normalised power spectrum for Had/HiGEM 1.2

5
ENSO in H1.1&2 vs H1.2 Low resolution H1.1 and H2 have long period variability Low resolution H1.2 does not – but the standard deviation remains similar HadGEM1.2 and HiGEM1.2 behave similarly – but (as in Hi1.1) the standard deviation of the high resolution model is greater
 the standard deviation of the high resolution model is greater")
6
Log(Spectral power) as function of longitude and period
 as function of longitude and period")
7
Wavelet power spectra for 1.1 & 1.2 models

8
Wavelet for different periods of HadGEM2

9
© Crown copyright Met Office Had/HiGEM1.1 vs Had/HiGEM1.2 Main differences are in the ocean Changed mixed layer parameters – decay scale depth (100 vs 50m), and wind mixing energy scaling factor (0.55 vs 0.7) – forcing more concentrated at surface in 1.2? HadGEM2 uses HadGEM1.1 values. Horizontal Laplacian viscosity (2000 m2/s vs 750- 750cos(lat)) – less viscous, stronger undercurrent in 1.2) – 1.2 same as HadGEM2. Vertical tracer mixing profile (less near-surface mixing in 1.2, sharper thermocline) – HadGEM2 has different profile from both 1.1 and 1.2. Vertical momentum mixing in HiGEM1.1 is 10x less than HiGEM1.2 (accidental), HadGEM1.1/1.2/2 have identical values.
) – less viscous, stronger undercurrent in 1.2) – 1.2 same as HadGEM2. Vertical tracer mixing profile (less near-surface mixing in 1.2, sharper thermocline) – HadGEM2 has different profile from both 1.1 and 1.2. Vertical momentum mixing in HiGEM1.1 is 10x less than HiGEM1.2 (accidental), HadGEM1.1/1.2/2 have identical values..")
10
UJCC-HIGEM models Can we understand the differences in ENSO behaviour through the different model parameters? Certainly the parameters make a difference to the mean states –Equatorial Undercurrent is stronger with less horizontal viscosity –thermocline is tighter with reduced vertical diffusion –Effect of ML parameters? Pete Inness ran HadGEM1.2 for 10 years with 1.1 parameters, but nothing obvious in such a short time

11
Temperature at equator for Had/HiGEM1.1,1.2,2 models & obs

12
Equatorial undercurrents from Had/HiGEM1.1/1.2/2 models

13
Equatorial zonal currents for GEM1.1 and sensitivity studies

14
Nino3 power spectrum of HadGEM1.1 (100 years), then changes to ML parameters or horizontal viscosity
, then changes to ML parameters or horizontal viscosity")
15
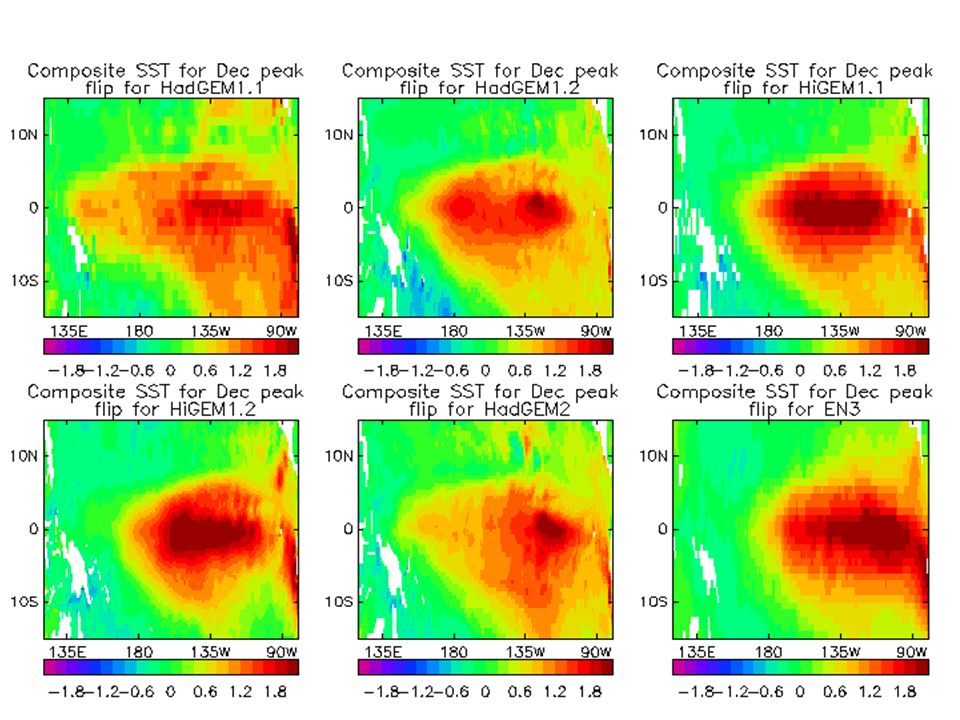
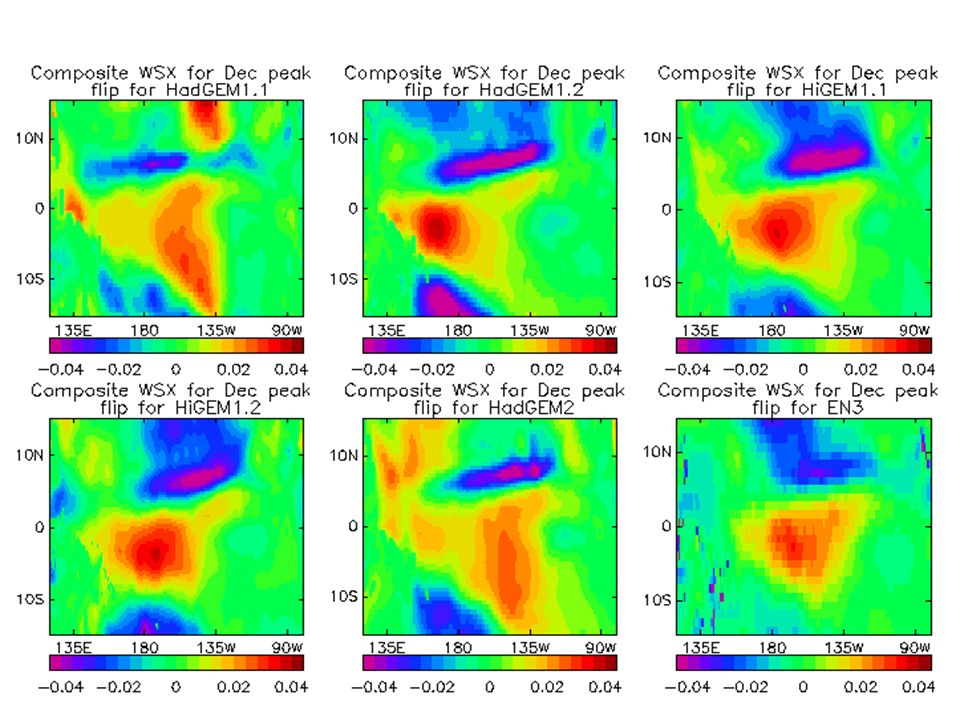
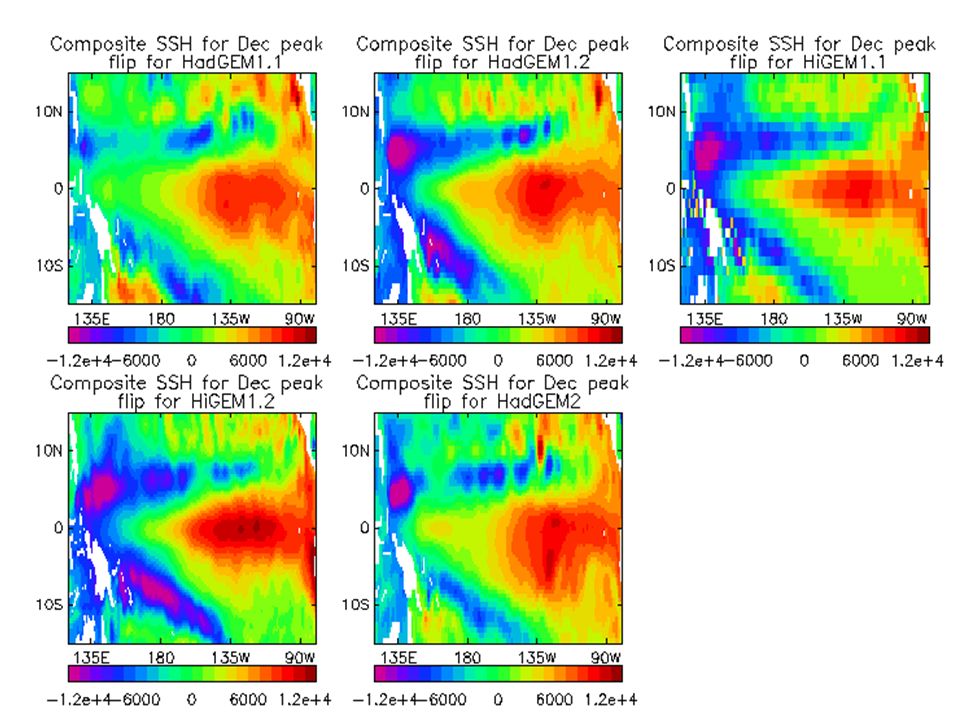
El Nino composites HiGEM1.1 doing a very nice job of evolution of SST, wind stress and heat content anomalies (which are important in ENSO timescales) HadGEM1.1 much weaker, heat content anomalies much less convincing. Also shows two different behaviours – flip and no-flip in year after El Nino (as discussed previously). Heat content 0-200m heat content here
. Heat content 0-200m heat content here.")
16
Nino3 SST gradient at peak Nino causes zonal wind stress anomalies, which cause Rossby waves Coupled Kelvin wave causes Nino termination Delayed oscillator mechanism

17
Sea surface height anomaly for composite El Nino event (4S-4N)
")
18
Sea surface height anomaly for composite El Nino event (4N-8N)
")
19
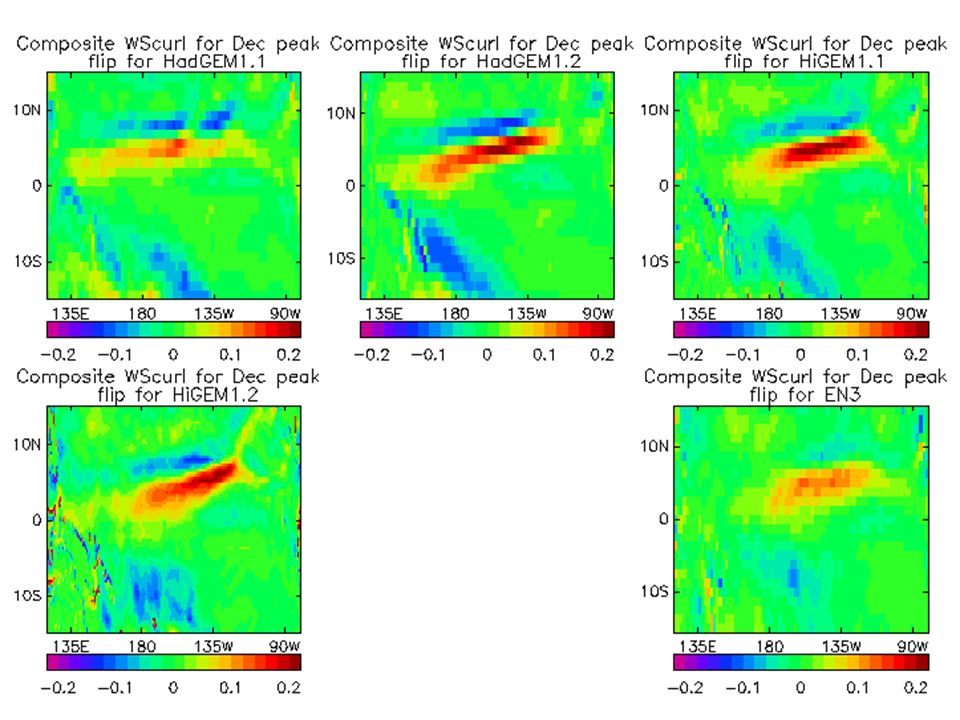
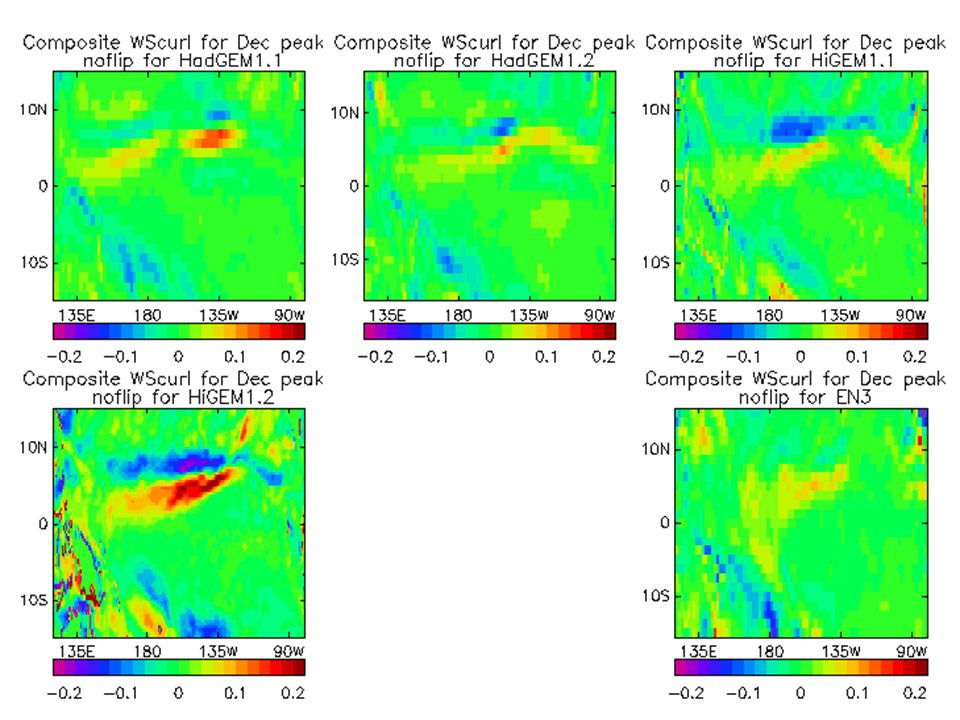
Possible mechanisms for heat content anomaly/Rossby waves Wind stress curl will cause upwelling or downwelling in the ocean, and hence change the heat content Wind stress/surface pressure pattern set up by the El Nino pattern can cause anomalous wind stress curl in the West Pacific north of the equator Some papers suggest that tropical cyclones or similar may play a role in causing the ocean upwelling – spun off the enhanced SST/SST gradients in the central Pacific

28
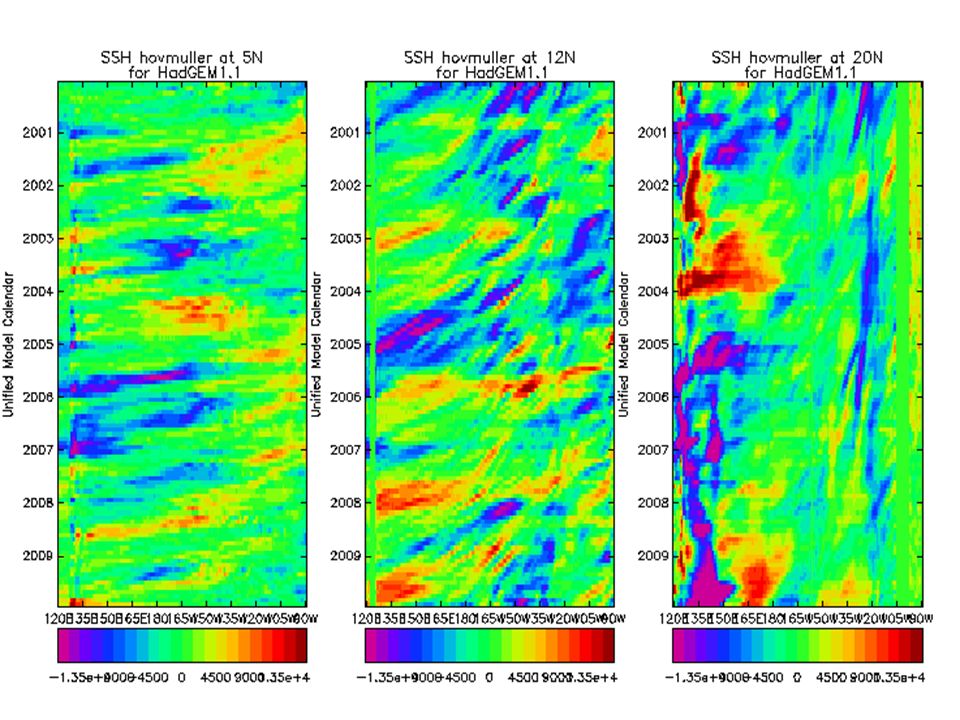
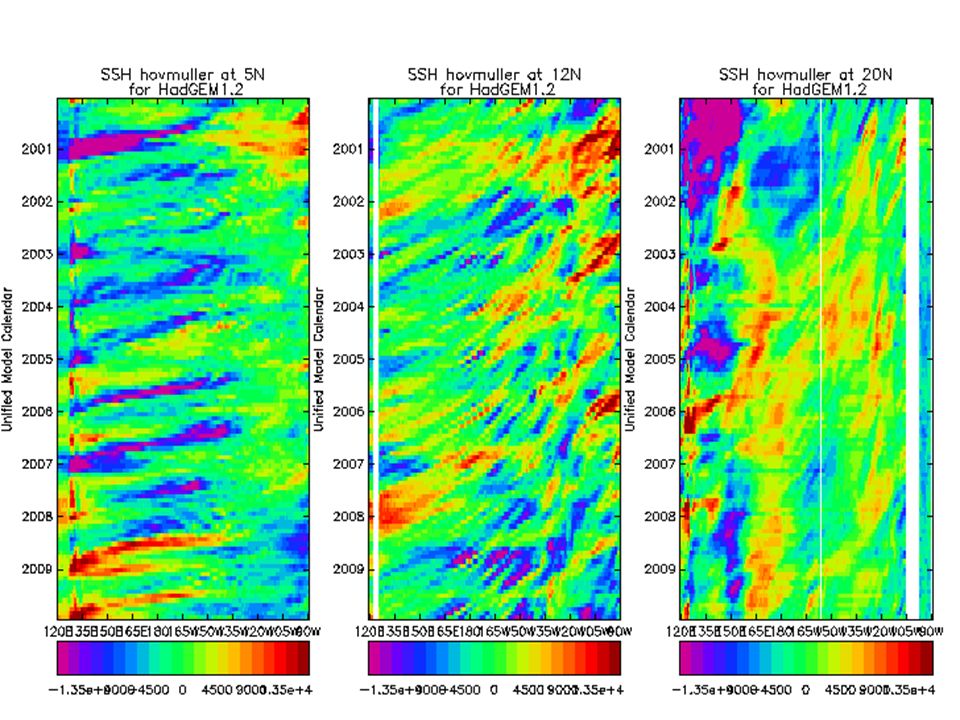
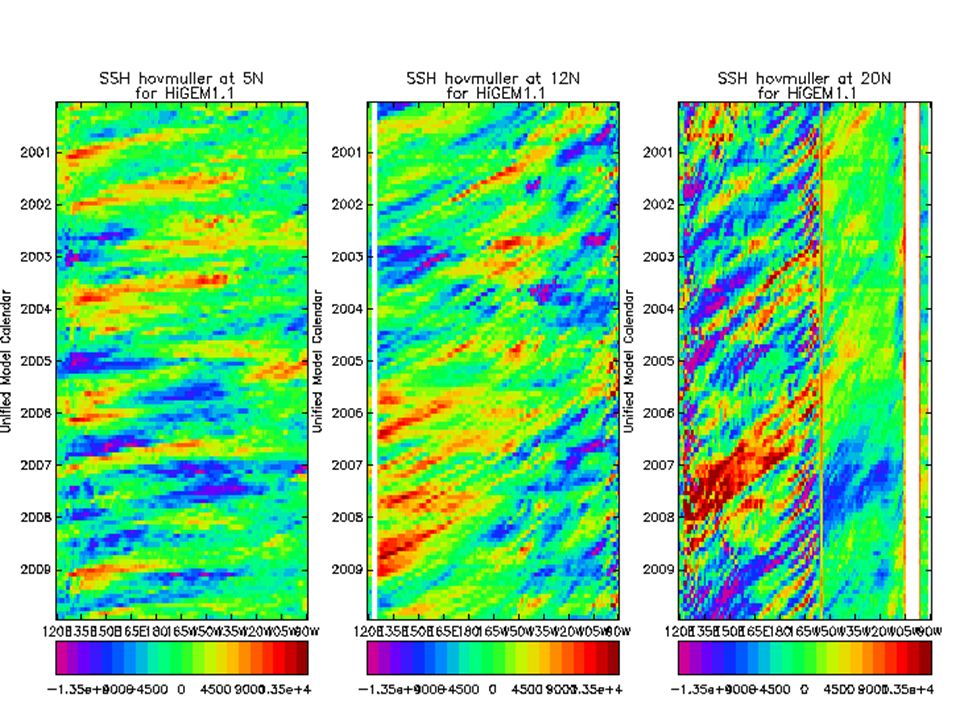
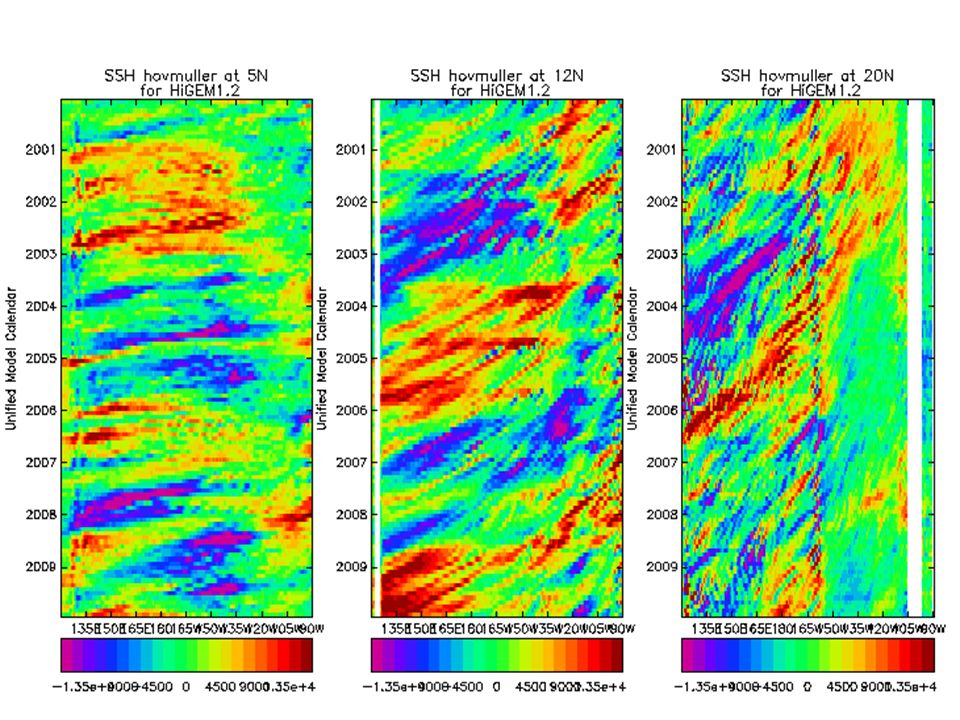
Oceanic Rossby waves Rossby wave speeds seem to agree reasonably well with observations/theory Low resolution models do not show much evidence of waves at higher latitudes (damping?) Influence of Hawaii to give smaller scale wind stress curl around 150W
 Influence of Hawaii to give smaller scale wind stress curl around 150W")
29
Rossby wave speeds vs latitude (obs and theory)
")
34
© Crown copyright Met Office ENSO summary Higher resolution model does a much better job of ENSO termination, with off-equatorial process potentially important Hence timescales are much more realistic Exact mechanism for heat content/Rossby wave initiation are not yet clear, indeed which element of the increased resolution helps the ENSO process is not clear yet

35
© Crown copyright Met Office Future ENSO work Assessment of cloud feedback in SEP region Effects of different ENSO spatial scales on upper air Rossby waves and hence teleconnections Pin down exact mechanism for ENSO termination in HiGEM Look at 4x CO2 HiGEM integration – impact on ENSO? Understand HadGEM1.2 results – low resolution but ENSO power spectrum like HiGEM1.1

36
© Crown copyright Met Office END

37
Nino3 SST non-normalised power spectrum

39
Nino6 regionNino3 region Nino3 -0.73-0.55-0.11Nino3 SST /Nino6 ht cont -0.34-0.550.14Nino3/Nino6 SST corr ObsHiGEM1.1HadGEM1.1Model Correlation between Nino3 SST and Nino6 SST/heat content

40
Nino3 Lag correlation of Nino3 SST (striped) and 0- 200m ocean heat content anomaly in different regions of Pacific (colours), showing wave/signal propagation and teleconnections ENSO termination
 and m ocean heat content anomaly in different regions of Pacific (colours), showing wave/signal propagation and teleconnections ENSO termination")
41
Nino3 Lag correlation of Nino3 SST (striped) and 0- 200m ocean heat content anomaly in different regions of Pacific (colours), showing wave/signal propagation and teleconnections ENSO termination
 and m ocean heat content anomaly in different regions of Pacific (colours), showing wave/signal propagation and teleconnections ENSO termination")
42
150 yrs 100 yrs 20 yrs

43
HadGEM1.1HiGEM1.1 CMAP observations El Niño DJF precipitation anomalies (mm/day)
")
44
Important element of global climate variability Has great impact on global carbon cycle; fairly difficult to reproduce realistically in GCMs ENSO

45
Composite El Nino events for HadGEM1.1 (flip), HiGEM1.1 and EN3/ERA-40 observations
, HiGEM1.1 and EN3/ERA-40 observations")
46
ENSO termination mechanism HiGEM1.1 and EN3 observations seem to have strong connection between Nino3 SST and Nino6 (140-160E, 8-15N) SST (and heat content) – after Wang et al (1999). HadGEM1.1 seems to lack this connection. This may be through wind stress curl, either locally (perhaps through teleconnection via sea-level pressure, or via tropical-cyclone-like activity), or via remote Rossby waves across the Pacific from the eastern boundary Seems likely that HadGEM1.1 lacking this connection may lead to its poor termination of ENSO, and hence contributing to the longer peak power. However, there are many suggested mechanisms for ENSO phase change
, or via remote Rossby waves across the Pacific from the eastern boundary Seems likely that HadGEM1.1 lacking this connection may lead to its poor termination of ENSO, and hence contributing to the longer peak power. However, there are many suggested mechanisms for ENSO phase change.")
47
Hovmuller diagrams of SST and SSH for HiGEM1.1 Equator SSTEquator SSH4N-8N SSH

48
Hovmuller diagrams of SST and SSH for HadGEM1.1 Equator SSTEquator SSH4N-8N SSH

49
Hovmuller diagrams of SST and SSH for observations Equator SSTEquator SSH4N-8N SSH

Similar presentations


 Ocean-atmosphere interactions.>")
 and R. Washington (Oxford University)>")


 20 April 06 Byoung-Cheol Kim METEO 6030 Earth Climate System.>")

