Download presentation
Presentation is loading. Please wait.

1
M EASUREMENT AND OPTIMIZATION OF DRILLING PROCESS PARAMETERS Presented by: 100190119001 Rahul Bhat 100190119010 Hardik Thummar 100190119011 Maunik Kaneriya 100190119028 Vivek Kachhadiya Guidance by Prof. N. H. PRAJAPATI

2
DRILLING DEFINATION Drilling is a process of making hole or enlarge a hole in an object by forcing a rotating tool called drill. When a drill is cutting it has to overcome the resistance offered by the metal and a twisting effort is necessary to turn it. The torque required to operate the drill is dependent upon various factors, but for most of the practical purposes, the relation between the torque, the diameter of drill and the feed has found to be most satisfactory, based on experiment results.

3
DRILLING PROCESS PARAMETERS Wear Drill bit Feeds rate Spindle Speed Cutting speed Depth of cut Coolants Point angle Surface finishing Tolerance of holes Torque Force Time Vibration

4
WHY PARAMETERS MEASURMENT AND OPTIMIZATION Real time optimization of drilling process parameters during drilling operation for obtaining maximum drilling rate as well as minimum drilling cost, to get high productivity and high MRR by changing process parameters such as drilling diameters, cutting speed and feed rate. For also improve drilling performance like tool life, material removal rate.

5
AFFECT OF PARAMETERS The relationships between the cutting force signals and drill wear as well as other cutting parameters including spindle rotational speed, feed rate and drill diameter were established by lots of experiments. The tool wear can be estimated knowing the thrust force, feed per revolution and drill diameter. The temperature of cutting edge increases with the increase of spindle speed (cutting speed) and feed rate.
 and feed rate..")
6
coolant can perform roll for reduction tool temperature, thrust force, surface roughness. Amount of metal remove is function of speed and feed. Feed is varies from 0.05mm to 0.35mm per revolution and it’s variation is depends on hard and soft material. Wear is thought to occur from chemical reactions in the contact zone between the tool and the work piece. Precise measurements of tool dimensions indicated that the wear was concentrated at the tool center region and at the intersection between the conical and cylindrical regions.

7
Cutting speed: The cutting speed in a drilling operation refers to the peripheral speed of a point on the surface of the drill in contact with the work. The cutting speed (v) may be calculated as : v=(pi*d*n)/1000 m per minute. Where, d is the diameter of the drill in mm n is the rpm of the drill spindle. Feed: The feed of a drill is the distance the drills moves into the work at each revolution of the spindle. It is expressed in mm. the feed may also be expressed as feed per minute. The feed per minute may be defined as the axial distance moved by the drill into the work per minute. The feed per minute may be calculated as: S m = s r × n Where, S m = feed per minute in mm. S r = fee per revolution in mm. n = rpm of the drill.
 may be calculated as : v=(pi*d*n)/1000 m per minute. Where, d is the diameter of the drill in mm n is the rpm of the drill spindle. Feed: The feed of a drill is the distance the drills moves into the work at each revolution of the spindle. It is expressed in mm. the feed may also be expressed as feed per minute. The feed per minute may be defined as the axial distance moved by the drill into the work per minute. The feed per minute may be calculated as: S m = s r × n Where, S m = feed per minute in mm. S r = fee per revolution in mm. n = rpm of the drill..")
8
Depth of cut: The depth of cut in drilling is equal to one half of the drill diameter. The depth of cut (t) may be expressed as : t =D/2 mm Machining timing in drilling: T=L/(n* S r ) min. Where, n = r.p.m of the drill S r = feed per revolution of the drill in mm. L = length of the travel of the drill in mm. T = machining time in min. L = l 1 + l 2 + l 3 + l 4 Where, l 1 = length of the work piece l 2 = approach of the drill, l 3 = length of the drill point (0.29d), l 4 = over travel
 may be expressed as : t =D/2 mm Machining timing in drilling: T=L/(n* S r ) min. Where, n = r.p.m of the drill S r = feed per revolution of the drill in mm. L = length of the travel of the drill in mm. T = machining time in min. L = l 1 + l 2 + l 3 + l 4 Where, l 1 = length of the work piece l 2 = approach of the drill, l 3 = length of the drill point (0.29d), l 4 = over travel.")
9
F IELD WORK As per availability of measuring instruments which is required for parameters measurement We have to do experimental investigation for drilling process and optimization it’s parameters. Force, torque, Feeds rate, Spindle Speed, Cutting speed, power supply. Taguchi method is utilize while investigation for higher precision at lower experimental operations in our project.

10
THE TAGUCHI PROCESS 1. Problem identification 2. Brainstorming session 3. Experimental design 4. Run experiment 5. Analyze result 6. Confirmation runs

11
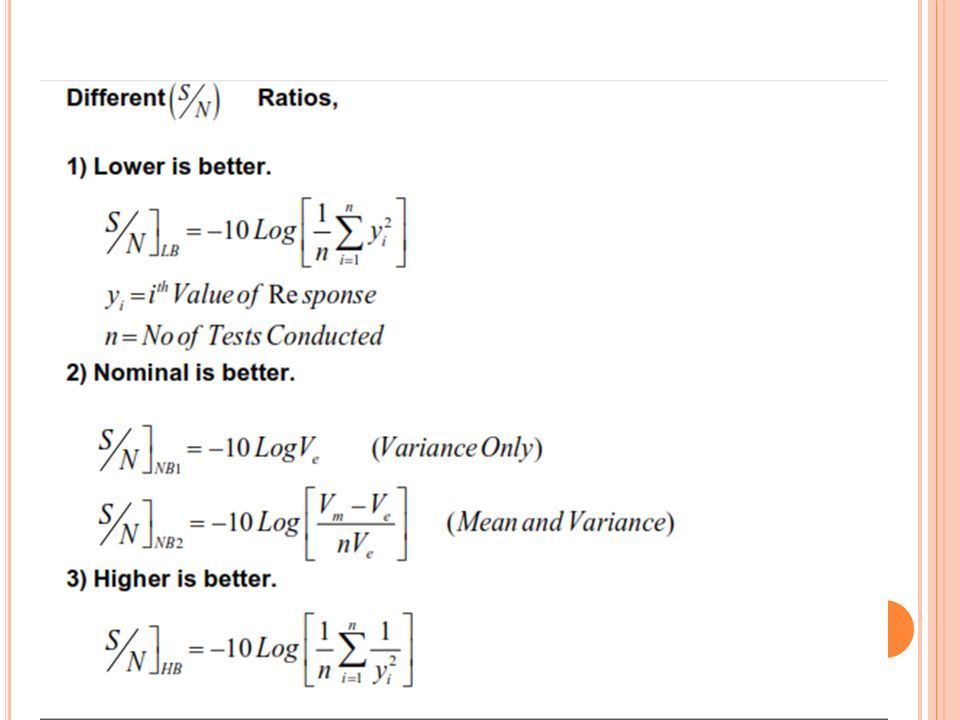
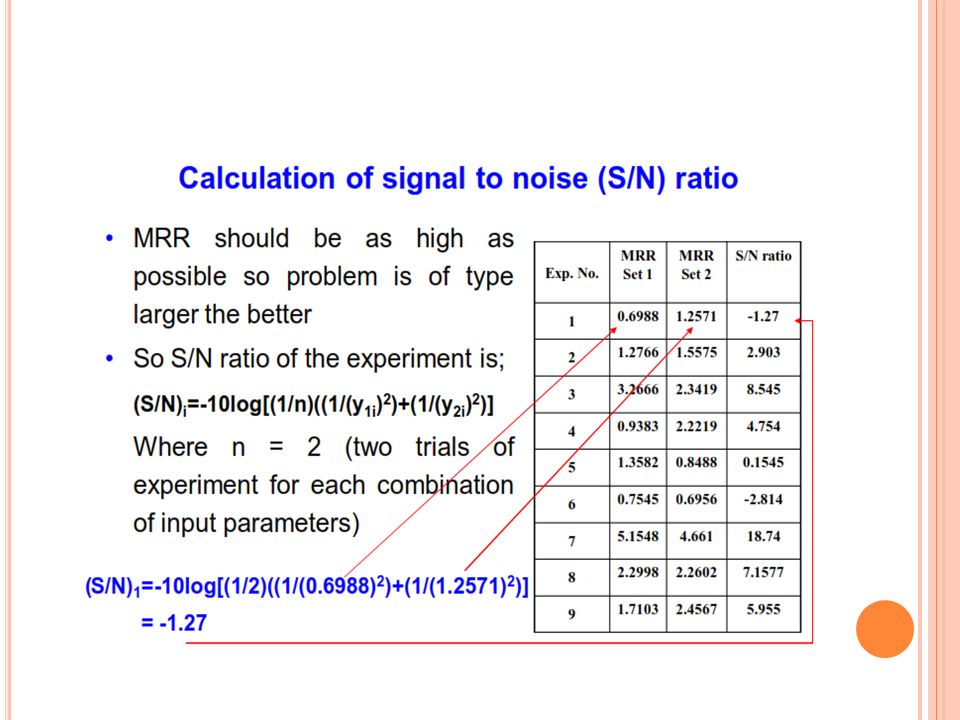
Noise [N]: It is the set of uncontrolled parameters which influence the final result or response Example: Environmental Condition, Human Interface Signal [S]: It is the output variable or response Example: Final output of result of an experiment or Magnitude of Response Variable for each experiment Signal to Noise Ratio [S/N]: This indicates robustness of an experiment. It consolidates several repetitions [at least two data points] into one value that reflects the amount of variation present.
![Noise [N]: It is the set of uncontrolled parameters which influence the final result or response Example: Environmental Condition, Human Interface Signal [S]: It is the output variable or response Example: Final output of result of an experiment or Magnitude of Response Variable for each experiment Signal to Noise Ratio [S/N]: This indicates robustness of an experiment.](http://images.slideplayer.com/39/10890683/slides/slide_11.jpg "It consolidates several repetitions [at least two data points] into one value that reflects the amount of variation present..")
20
REFRENCES Workshop Technology-2 By Hajara Chaudhary 13 th edition Production Technology By R. K. Jain, Khanna publication 16 th edition Design Of Experiment BY Dr. S. A. Chaniwala S.C. Lin and, C.J. Ting(Tool wear monitoring in drilling using force signals) T. Ueda, R. Nozaki and A. Hosokawa(Temperature Measurement of Cutting Edge in Drilling) Scott F. Millera, Peter J. Blaub, Albert J. Shiha,(Tool wear in friction drilling)
 T. Ueda, R. Nozaki and A. Hosokawa(Temperature Measurement of Cutting Edge in Drilling) Scott F. Millera, Peter J. Blaub, Albert J. Shiha,(Tool wear in friction drilling).")
21
Thank you

Similar presentations


 Leon Xu The Boeing Company December 20, 2007.>")


 Metal Joining ( Welding, Brazing and Soldering) Metal Forming & Casting.>")

 EIN 3390 Manufacturing Processes Spring, 2012 1.>")