Download presentation
Presentation is loading. Please wait.

2
What is a map? A Map is a two or three-dimensional model or representation of the Earth’s surface. 2-Dimensional map

3
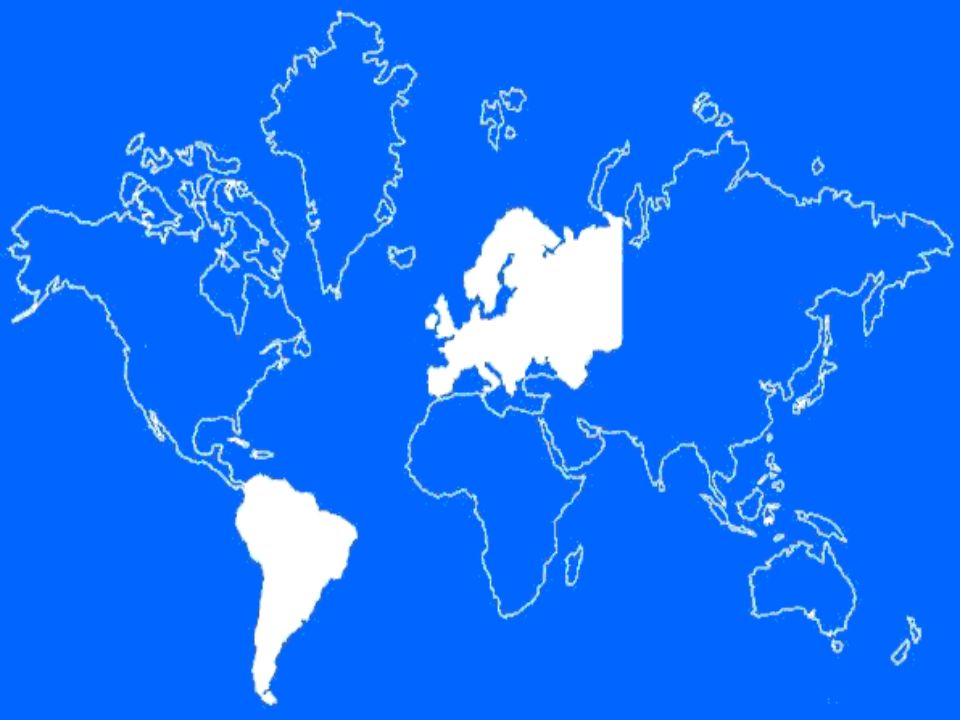
What is a “Map Projection”? Planar Projection

4
Projection A Projection is a mathematical means of transferring information from the Earth’s three-dimensional curved surface to a two- dimensional map.

5
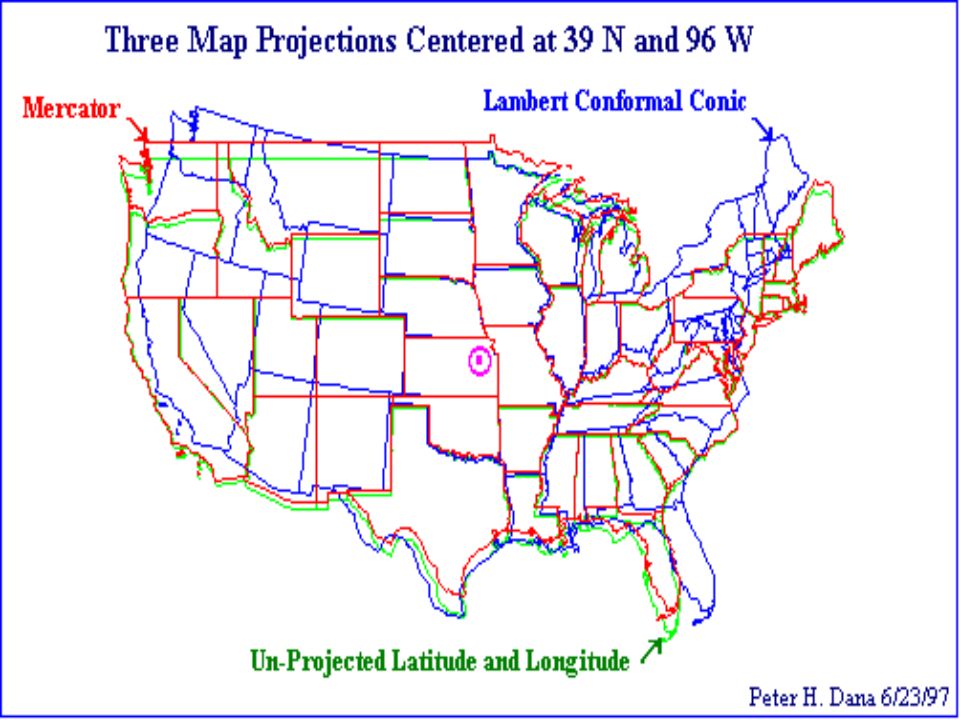
Types of Map Projections All map projections are “flawed” by distortions that are created during “projection”. Different map projections have been developed to reduce this distortion to different areas of the map for different purposes.

6
Cylindrical Projections Notice the effect that different types of projections have on the shape of meridians (lines of longitude) and parallels (lines of latitude).
 and parallels (lines of latitude).")
7
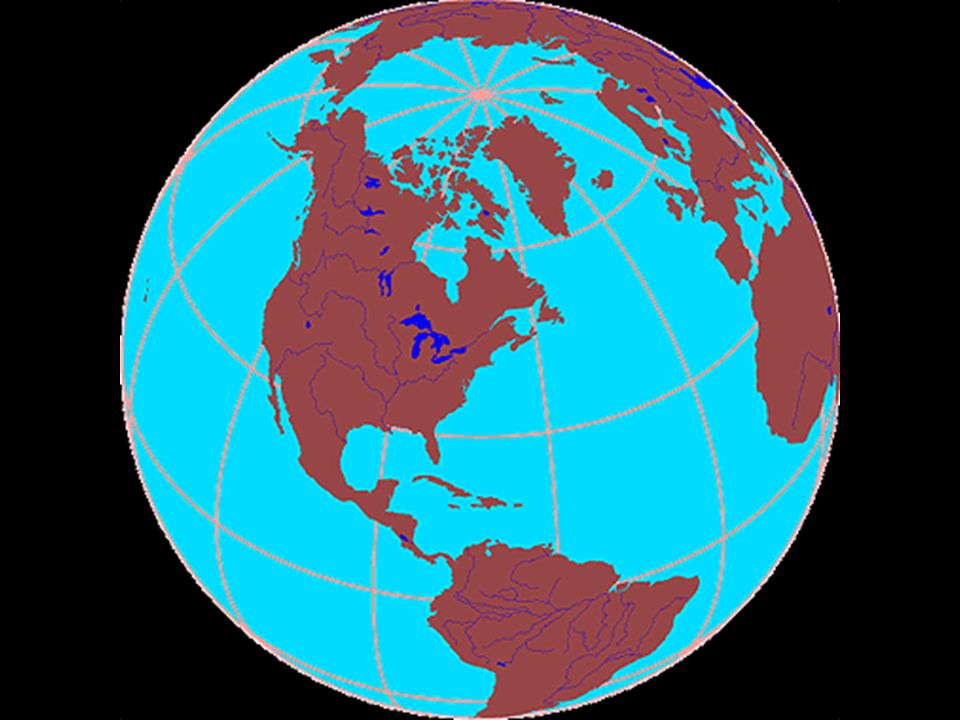
Planar Projections

8
Conical Projections

9
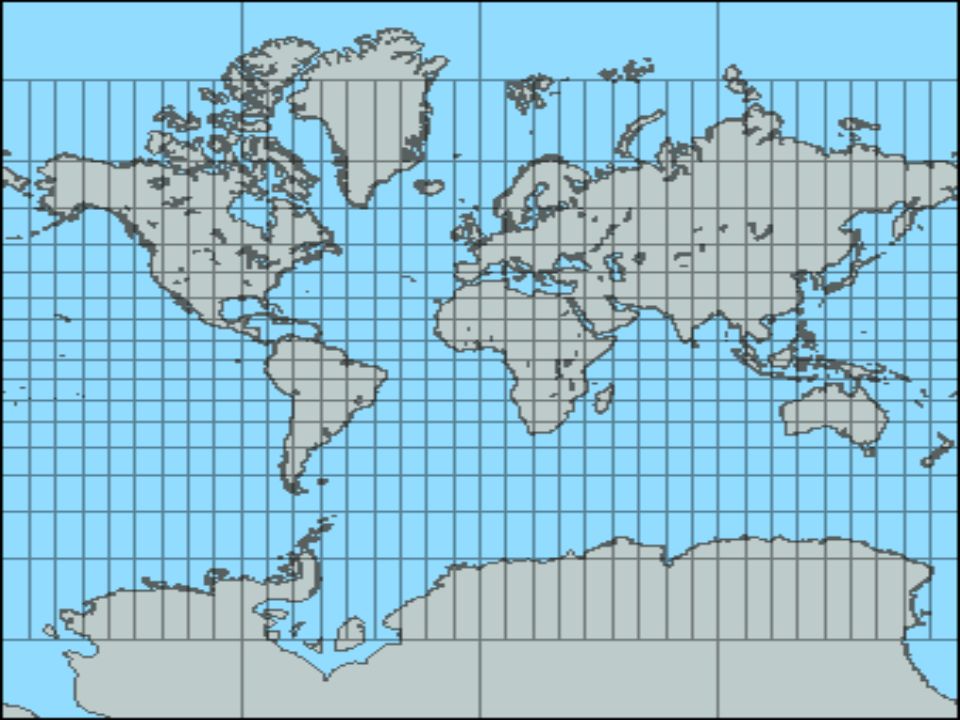
Mercator Projection (Cylindrical Projection)
")
10
Mercator Projection Great Distortion of area and shape at high latitudes. True shapes and distances within 15 Degrees of the Equator.

11
Robinson Projection Better balance of size and shape of high latitudes, and low distortion within 45 degrees of the Equator. Used by National Geographic for world maps since 1988, and replacing Mercator in schools.

12
Map Distortions Greenland Mercator map size True size of Greenland

13
In this image, Scandanavia (high lat.) is Larger than India (equatorial).
 is Larger than India (equatorial).")
18
Latitude and Longitude Where am I? Early Greeks and Chinese attempted to create a grid system to help them answer this question. But it was not until the Middle Ages that the latitude/longitude system was developed.

19
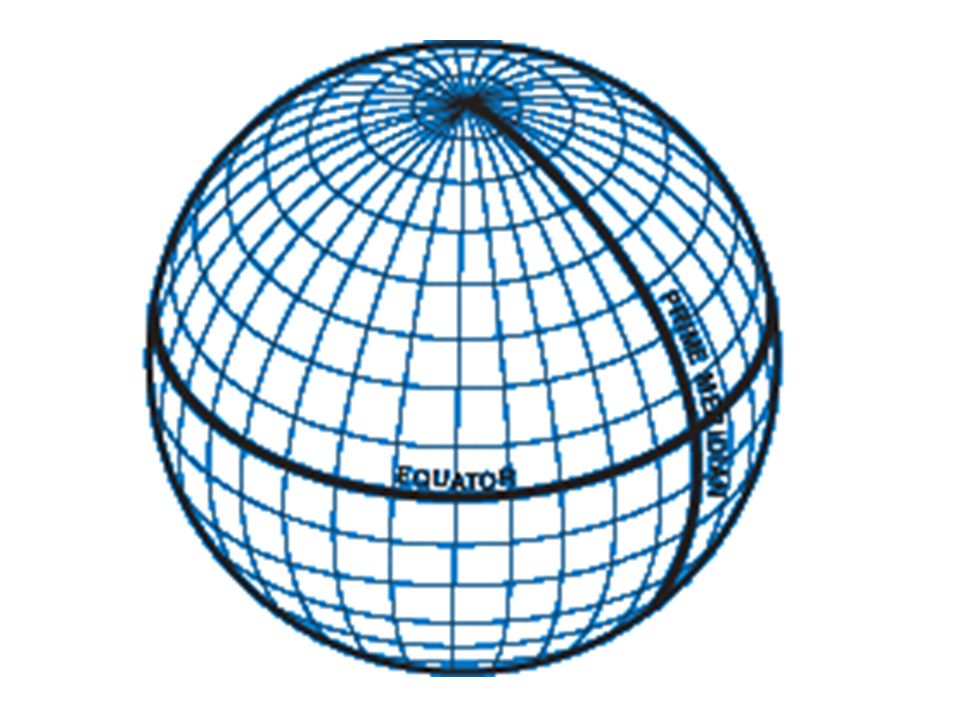
Latitude and Longitude Cartographers (mapmakers) have established a set of vertical and horizontal grid lines that cover the globe called: Parallels- Lines of Latitude (horizontal) Meridians- Lines of Longitude (Perpendicular) Because the Earth is a sphere, each line represents a 1 degree slice of the 360 degrees in a the sphere.
 have established a set of vertical and horizontal grid lines that cover the globe called: Parallels- Lines of Latitude (horizontal) Meridians- Lines of Longitude (Perpendicular) Because the Earth is a sphere, each line represents a 1 degree slice of the 360 degrees in a the sphere.")
21
Lines of Latitude Equator Parallels dissect the Globe like a a tomato is cut.

23
Notice the “stretching” that takes place near the poles.

25
Latitude Line “Rules” Run East to West Measure distance in degrees from the Equator Each line forms a circle around the Earth that is vertically equidistant from the equator. Numbered from 0 to 90 Degrees (0 being the equator, and 90 being the poles)
.")
26
Lines of Longitude Prime Meridian

27
Longitude Line “Rules” Run North to South Measure distance in degrees from the Prime- Meridian Form half-circles that are equidistant from each other at the Equator, but converge at the poles. 0 Degrees Longitude is at Greenwich, England (established in 1883); 180 Degrees is in the Pacific, and is called the International Date Line (divides the Globe between two days).
; 180 Degrees is in the Pacific, and is called the International Date Line (divides the Globe between two days)..")
30
Time Zones The Earth takes 24 hours to rotate once on its axis. Therefore, the Earth has been divided into 24 Time Zones. Time Zones are a geophysical world globe division of 15 o each, starting at Greenwich, England, created to help people know what time it is now in another part of the world (see page 76 in your text for a good Time Zone tool).
..")
31
International Date Line 0 degrees Longitude 0 +1 -11 +10

32
INTERNATIONAlINTERNATIONAl DATE LINeDATE LINe

34
The Earth can be divided into vertical and horizontal halves called Hemispheres.

35
The Equator-Divides Northern and Southern Hemisphere Equator

36
The Prime Meridian-Divides Eastern from Western Hemisphere. Prime Meridian

37
The Degree is the basic unit of Latitude and Longitude A general location on the globe would be shown as 45 N. A more precise location on the globe would be 45 15’ 35” N.

38
How “big” is a Degree? Each degree in Latitude and Longitude is approximately 69 miles “wide” at the equator. Each degree can be divided into 60 subdivisions called minutes (1.15 miles in “width”). 45’ Each minute can be divided into 60 subdivisions (.019 miles, or 100 feet!). 35” So, your location on the globe can be very precisely identified, and would look like this: 97 35’ 42” N.
. 45’ Each minute can be divided into 60 subdivisions (.019 miles, or 100 feet!). 35 So, your location on the globe can be very precisely identified, and would look like this: 97 35’ 42 N..")
39
Meridian Distances

40
Every spot on Earth has an address that is determined by referencing, in degrees, minutes and seconds, the latitude and longitude of that location.

42
YOU ARE HERE!

43
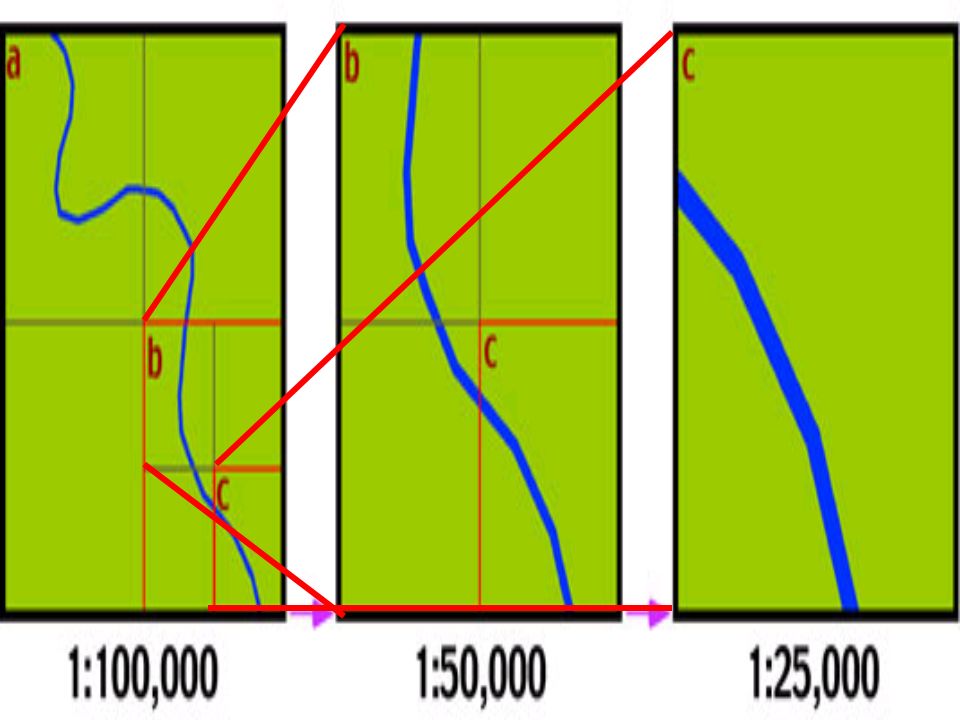
Map Scale Map Scale expresses the relationship between the distance on a map and the true, corresponding distance of the same area of the Earth’s surface. Mapmakers can't draw maps the same size as the area they represent; the maps would be too big. So they draw features smaller than they actually are.

44
A map scale is usually given as a fraction (1/10000) or a ratio (1:10000) USGS maps contain scales that have the same units on both sides of the ratio. Fractional scale

45
The larger the number on the right, the greater the amount of land that the map represents.

47
1:100000 scale 1:24000 scale

48
Bar Scale A bar scale is just a line drawn on a map of known ground length. There are usually distances marks along the line. Bar scales allow for quick visual estimation of distance.

49
Pay attention to where the zero point on the bar actually is when you measure with a bar scale! Notice that 0 is here!

50
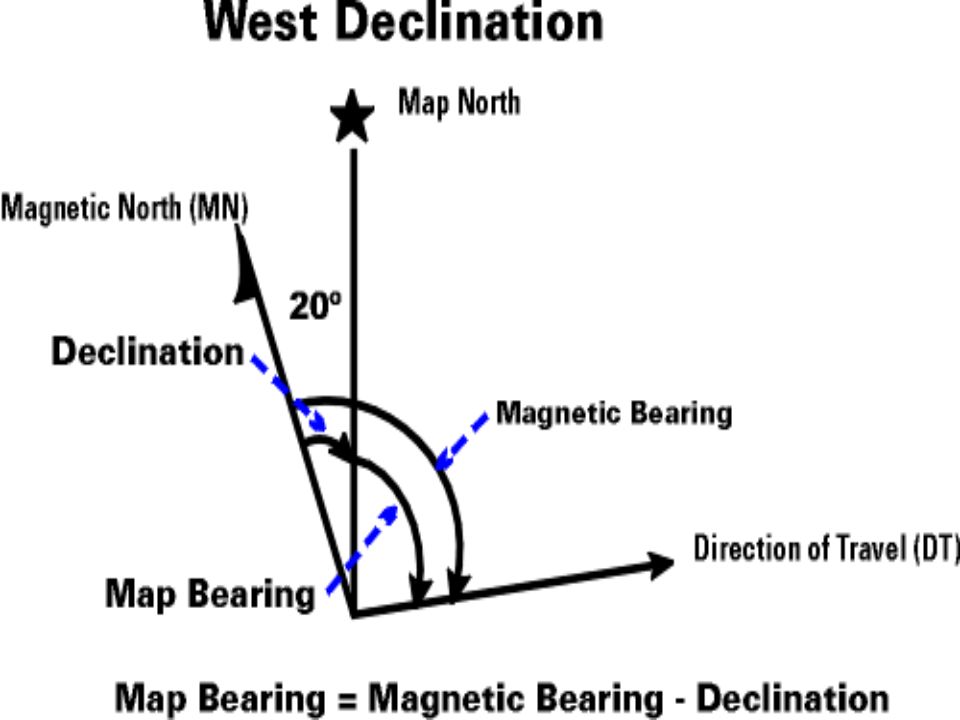
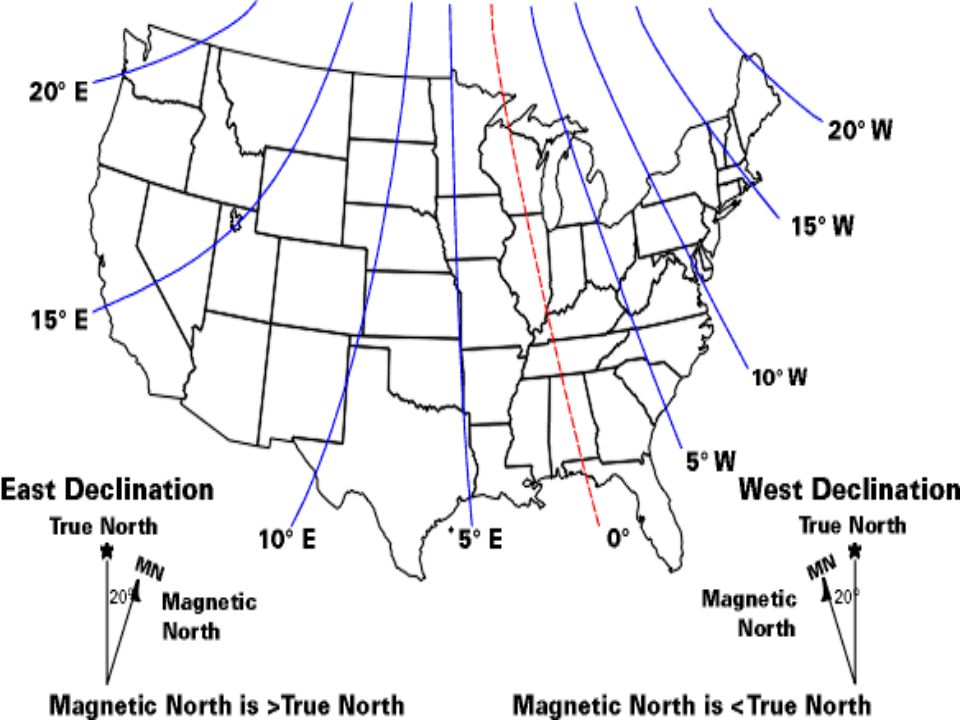
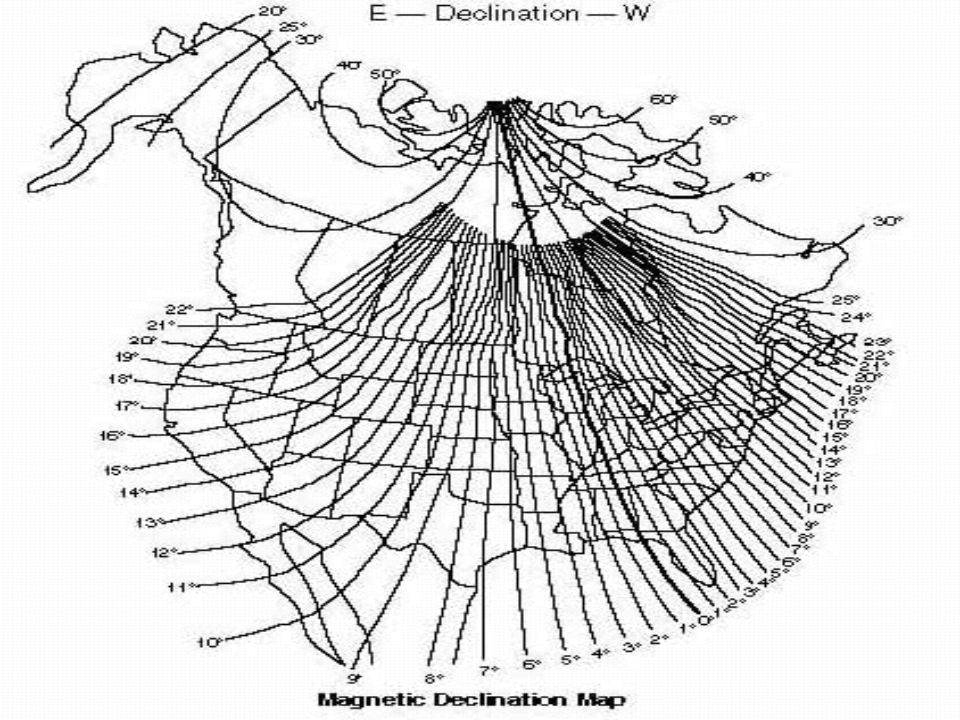
Magnetic Declination Because Magnetic North and Geographic- North are only the same in very few places, the direction in which the compass needle points is called Magnetic North, and the angle between magnetic north and true north is called Magnetic Declination.

52
Magnetic North True North

55
Declination or Degrees Off Course Error Off Target after Walking 10 Miles 1°920 feet (280meters) 5°4,600 feet (1,402 meters) 10°9,170 feet (2,795 meters) Effect of Magnetic Declination
 5°4,600 feet (1,402 meters) 10°9,170 feet (2,795 meters) Effect of Magnetic Declination")
56
Topographic Maps

57
A Topographic Map is the representation, normally on a flat surface,of part of the Earth’s surface, drawn to scale.

58
Topographic maps show distance relationships and elevation. Topography actually means, “the shape, elevation and slope of the land”.

59
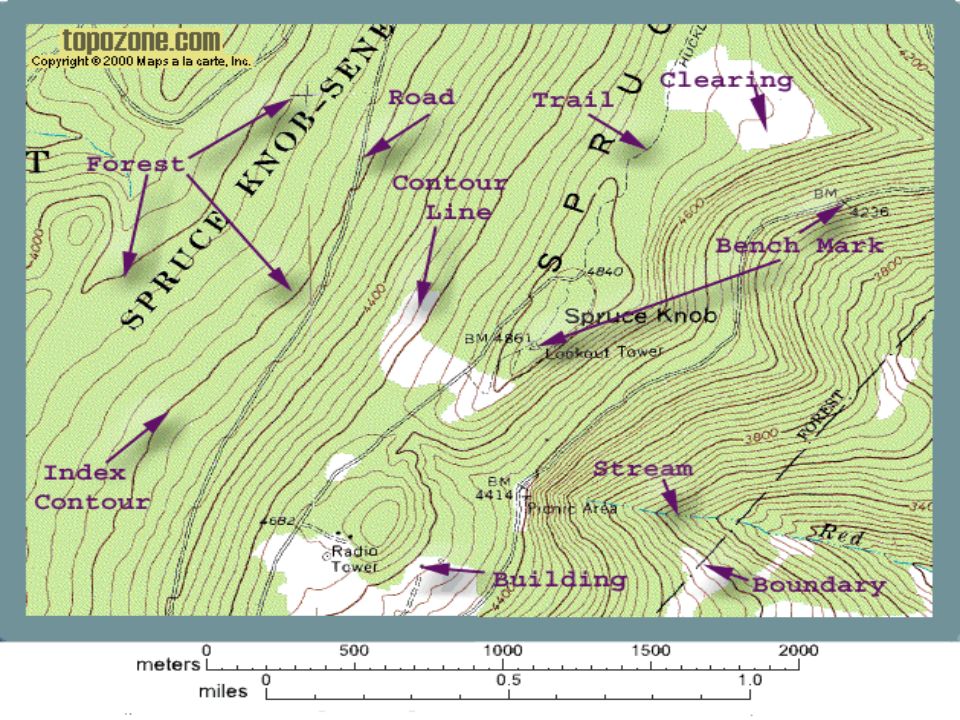
One of the main features of topographic maps are contour lines.

60
How do we know where to put the lines when we make a map???

61
Well, we could do it this way!!

62
We could start with an island, and increase the level of the ocean the amount of our contour interval, an marking the shore line as we raise the water level.

63
10 feet above normal sea-level Notice that the shape of the island changes. Why?

64
20 feet above normal sea-level

65
30 feet above normal sea-level

66
Now, drain the water, and we have our topographic map!

67
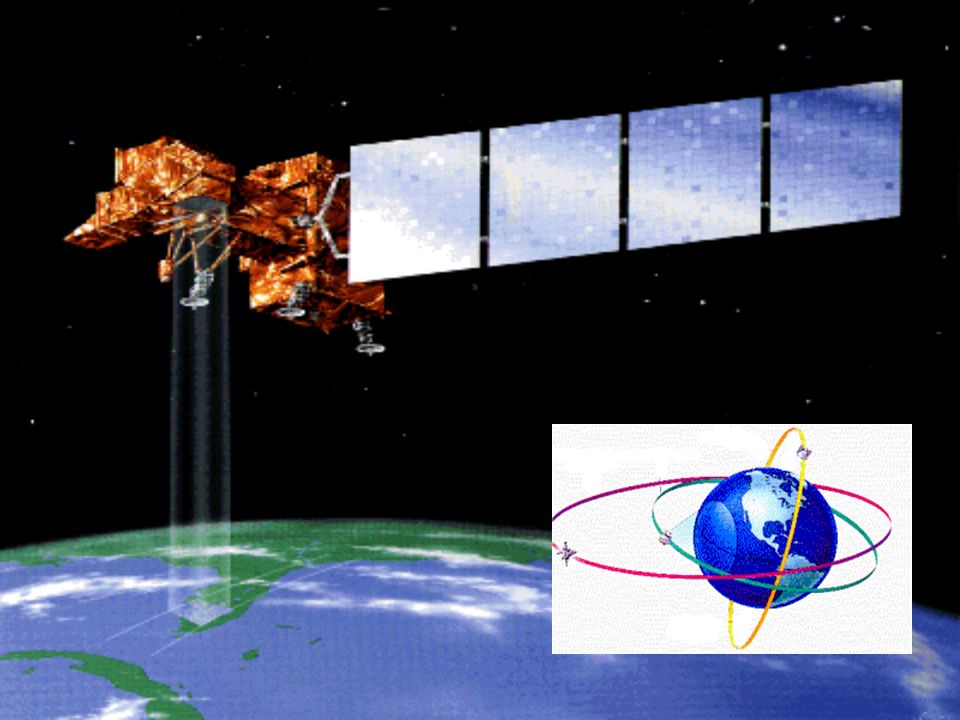
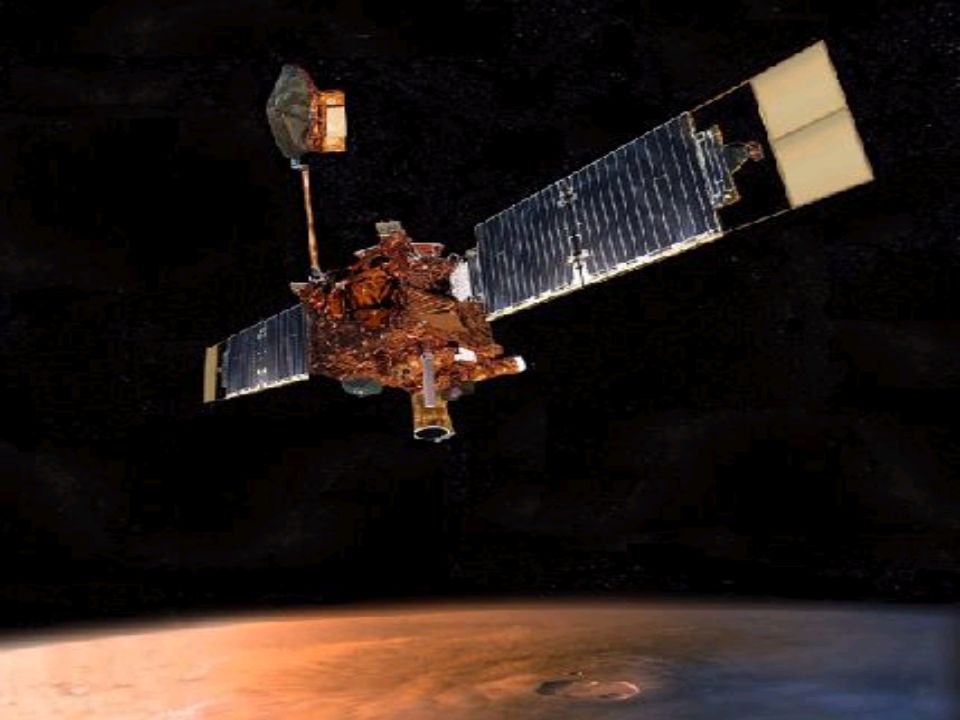
But, how do they do it for real??

68
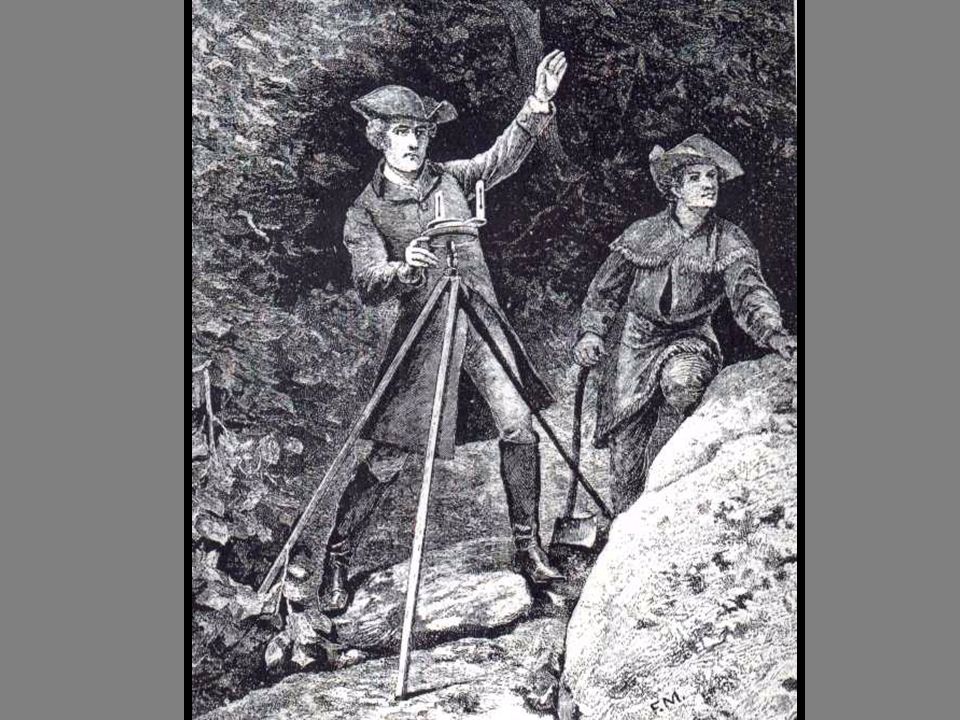
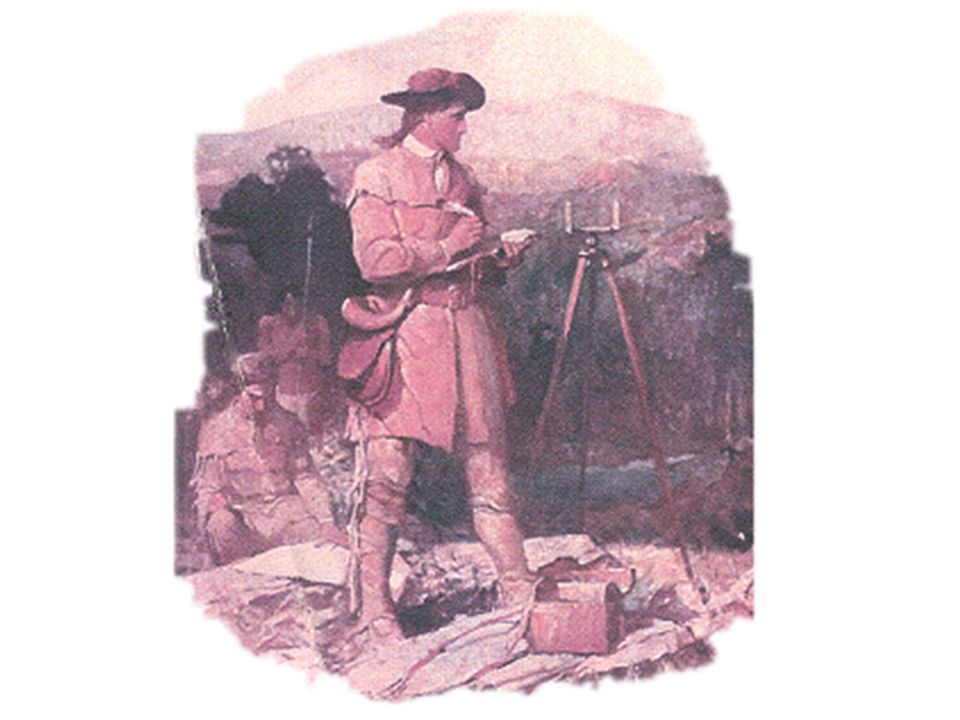
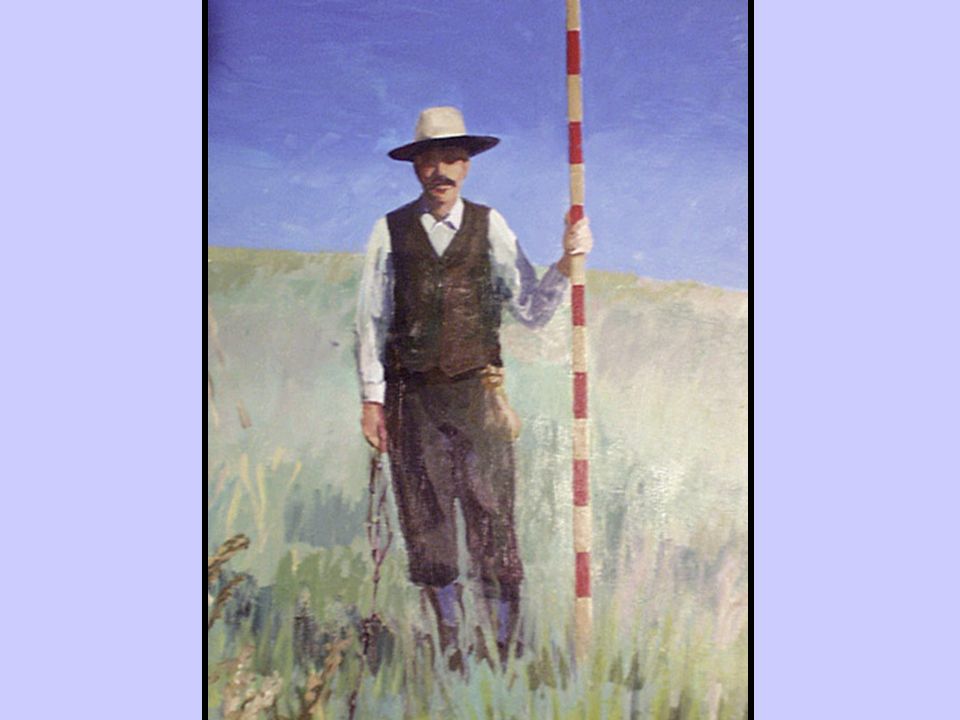
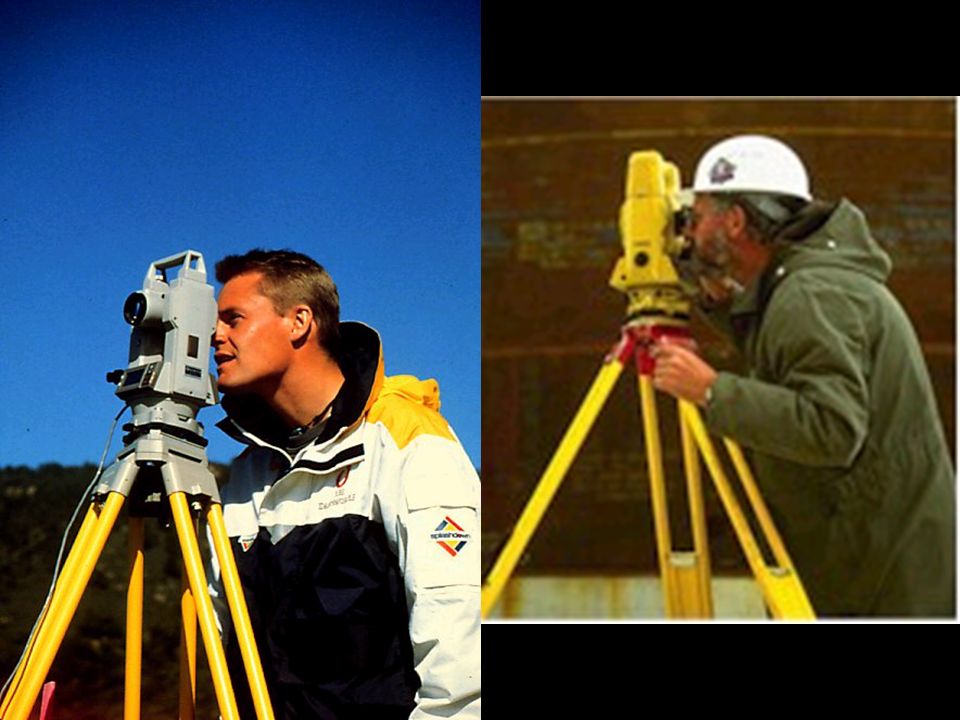
Survey Tools

82
“Fish Finder”

83
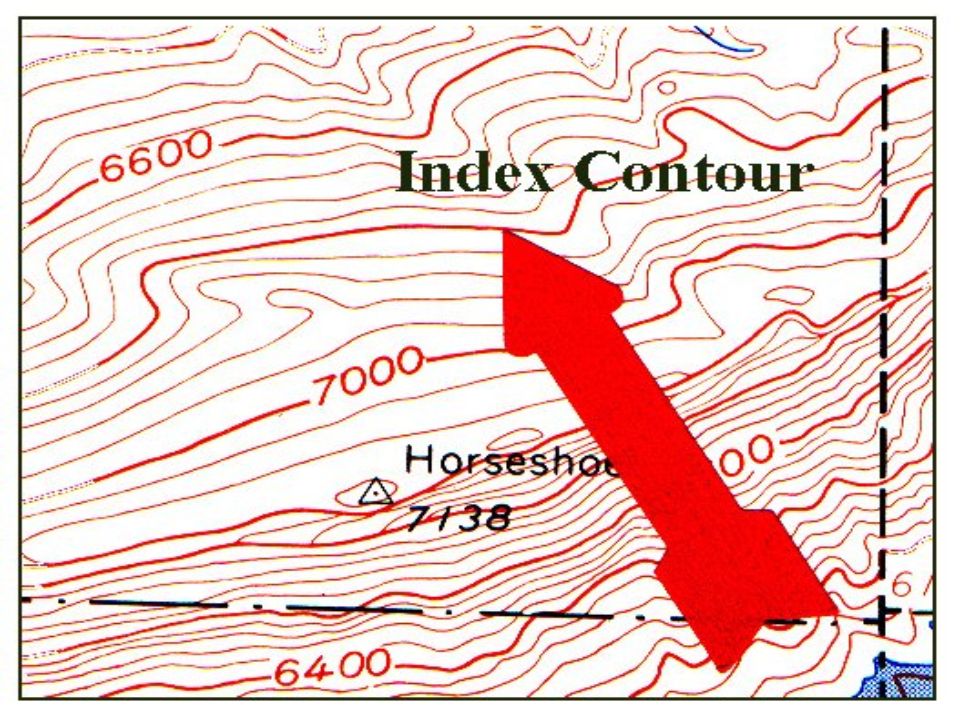
Contour Lines are Imaginary lines that join points of equal elevation on the land above or below sea level. All points on this line have an elevation of 250 feet above sea level, for example.

84
There are several different kinds of contour lines. Index Contour (darker, has elevation) Intermediate Contour (lighter; does not have elevation identified)
 Intermediate Contour (lighter; does not have elevation identified).")
86
Intermediate Contour

87
Depression Contour Lines Perp. Lines point downhill, into the depression Lip of depression is highest point

88
220 240 260 280 **Edge of depression is between 240-260.

89
Contour Lines make it possible to determine the shape of the land without looking at the actual spot. Ridge Valley

90
Topographic maps also include symbols that represent such features as woods, houses and roads. Woods Streams Roads House

92
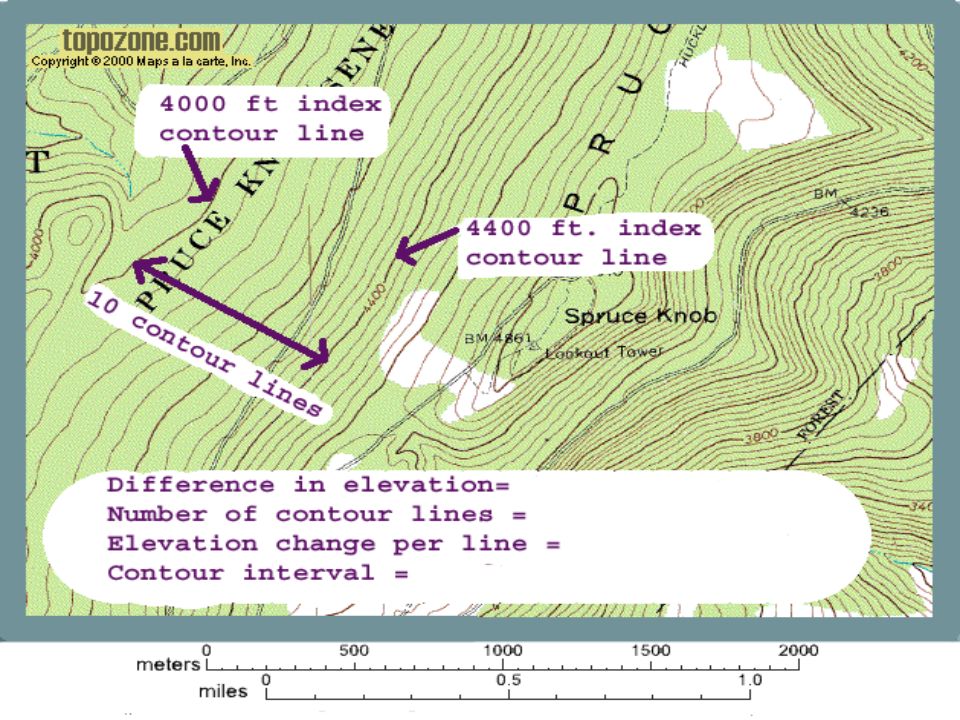
Contour Interval

94
Total Distance between Index Contours = Number of Spaces between Index Contours =

95
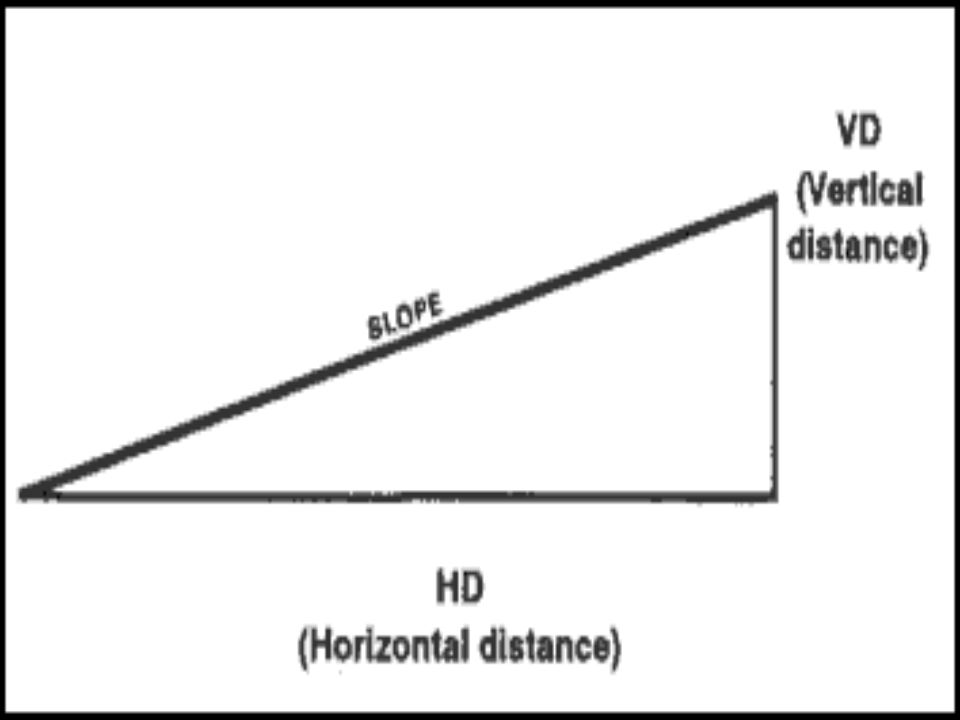
Slope Steep Slope Gentle Slope

96
Elevation increase between two identified points/distance between two horizontal points.

98
Line A Distance =.5 miles Elevation Change = Slope =

100
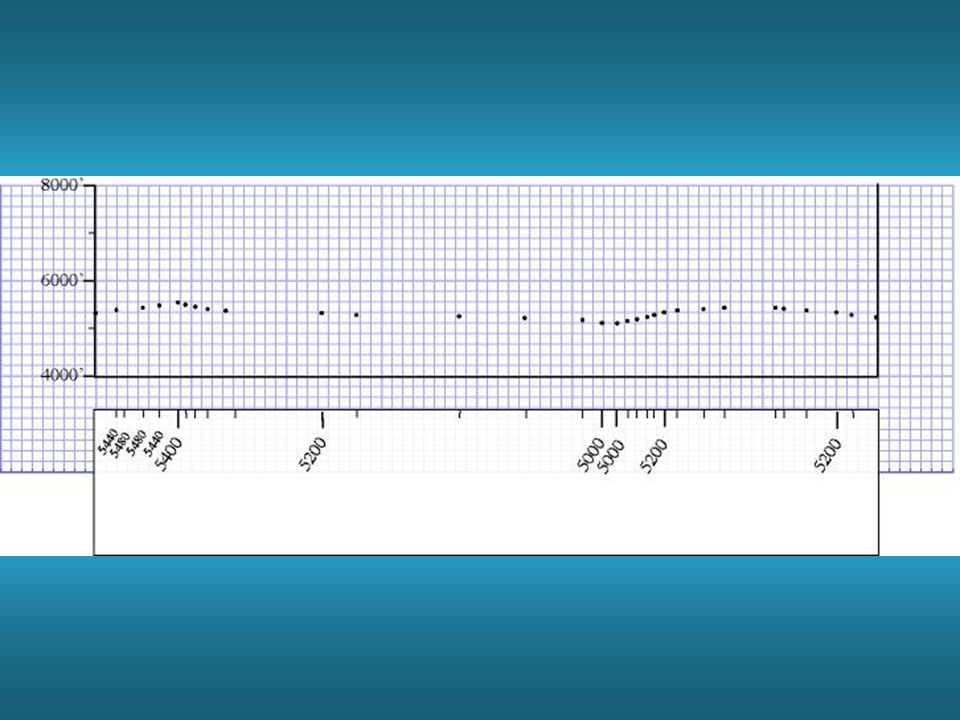
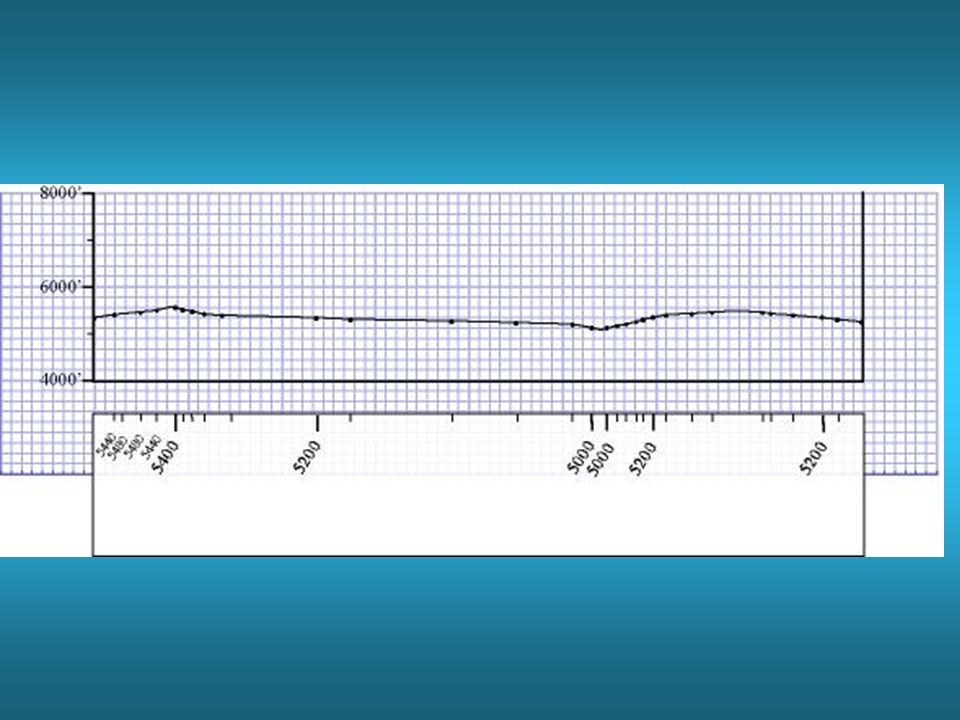
Topographic Profiles

106
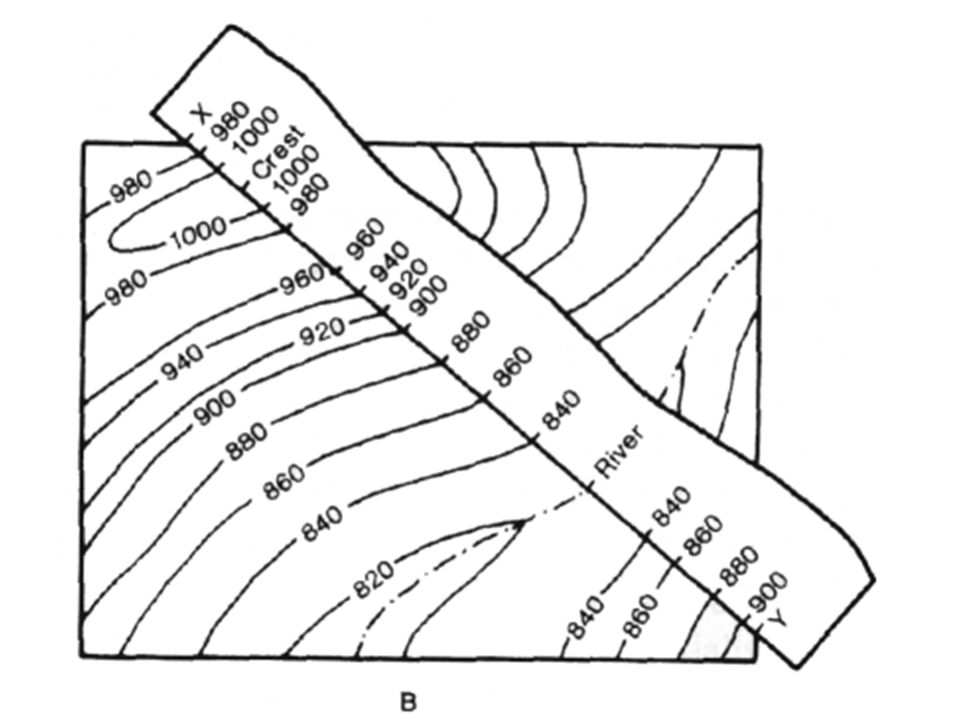
Stream Direction Determining stream direction of flow helps the map reader interpret elevations of intermediate contour lines above or below an Index Contour.

107
Notice V shape of canyon slopes

108
V’s point uphill. Therefore, line A must be less than 900, and line B must be more than 900 A B

109
Vertical Exaggeration

Similar presentations