Download presentation
Presentation is loading. Please wait.

1
Simpson's Paradox & Simpon’s 2 nd Paradox H. James Norton, William Anderson, Megan Templin Carolinas Medical Center, Charlotte, NC George Divine, Henry Ford Hospital, Detroit MI norton100@bellsouth.net Website: www.jimnortonphd.com

2
Paradox in published research goes back to at least the late 1800s See “The Pirates of Penzance” by Gilbert & Sullivan(1879)
")
4
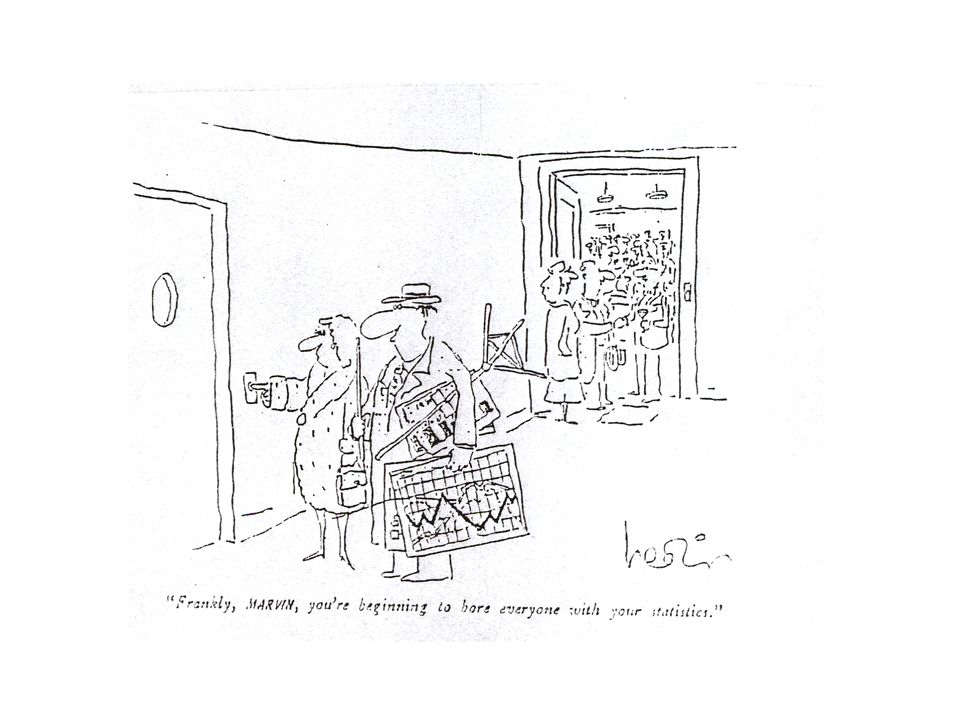
Keeping undergraduate biology students and medical residents interested in statistics, when the majority of the students are taking the class as a requirement, can be challenging

5
The following are examples of Simpson’s Paradox that you might find helpful in your course instruction.

6
Survival Rates DiedSurvivedDeath Rate Hospital A167842.0% Hospital B6320373.0% In which hospital would you want to have your surgery, A or B? Moore, D.S., McCabe, G.P., 1999, Introduction to the Practice of Statistics, 3 rd edition: W. H. Freeman.

7
Patients in Good Condition DiedSurvivedDeath Rate Hospital C85921.3% Hospital D65941.0% If you are in good condition, in which hospital would you want to have your surgery, C or D? Moore, D.S., McCabe, G.P., 1999, Introduction to the Practice of Statistics, 3 rd edition: W. H. Freeman.

8
Patients in Poor Condition DiedSurvivedDeath Rate Hospital C81924.0% Hospital D5714433.8% If you are in poor condition, in which hospital would you want to have your surgery, C or D? Moore, D.S., McCabe, G.P., 1999, Introduction to the Practice of Statistics, 3 rd edition: W. H. Freeman.

9
Survival Rates DiedSurvivedDeath Rate (%) Hospital A167842.0 Hospital B6320373.0 Good Condition Hospital C85921.3 Hospital D65941.0 Bad Condition Hospital C81924.0 Hospital D5714433.8 Hospital A is the combined data for Hospital C, Hospital B is the combined data for Hospital D.
 Hospital A Hospital B Good Condition Hospital C Hospital D Bad Condition Hospital C Hospital D Hospital A is the combined data for Hospital C, Hospital B is the combined data for Hospital D.")
10
Simpson’s Paradox Refers to the reversal of the direction of a comparison or an association when data from several groups are combined to form a single group.

11
Brief History of Simpson’s Paradox Yule, GU, 1903, “Notes on the theory of association of attributes in Statistics”, Biometrika, 2: 121–134. Cohen, MR, and Nagel, E, 1934, An Introduction to Logic and Scientific Method, New York: Harcourt, Brace and Co. Simpson, EH, 1951, “The interpretation of interaction in contingency tables”, Journal of the Royal Statistical Society (Series B), 13: 238–241. Blyth, CR, 1972, “On Simpson's Paradox and the Sure Thing Principle”, Journal of the American Statistical Association, 67: 364–366. Bickel, PJ, Hjammel, EA, and O'Connell, JW, 1975, “Sex Bias in Graduate Admissions: Data From Berkeley”, Science, 187: 398–404.
, 13: 238–241. Blyth, CR, 1972, On Simpson s Paradox and the Sure Thing Principle , Journal of the American Statistical Association, 67: 364–366. Bickel, PJ, Hjammel, EA, and O Connell, JW, 1975, Sex Bias in Graduate Admissions: Data From Berkeley , Science, 187: 398–404..")
12
Conditions when Simpson’s Paradox will not occur: Sample sizes are the same DiedSurvivedDeath Rate (%) Hospital A203805.0 Hospital B13228684.4 Good Condition Hospital A121886.0 Hospital B7514255.0 Bad Condition Hospital A81924.0 Hospital B5714433.8 # Hospital A Good Condition = # Hospital A Bad Condition = 200, # Hospital B Good Condition = # Hospital B Bad Condition = 1500
 Hospital A Hospital B Good Condition Hospital A Hospital B Bad Condition Hospital A Hospital B # Hospital A Good Condition = # Hospital A Bad Condition = 200, # Hospital B Good Condition = # Hospital B Bad Condition = 1500")
13
Conditions when Simpson’s Paradox will not occur: Rates are the same DiedSurvivedDeath Rate (%) Hospital C327844.0 Hospital D9524053.8 Good Condition Hospital C245764.0 Hospital D389623.8 Bad Condition Hospital C81924.0 Hospital D5714433.8
 Hospital C Hospital D Good Condition Hospital C Hospital D Bad Condition Hospital C Hospital D")
14
Examples of Simpson’s Paradox in the Literature Study TypeAuthorDependent Variable Independent Variable Stratification Variable EpidemiologicalCohendeathlocationrace EpidemiologicalMorrellmedical aidchildren (followed, not followed) race EpidemiologicalSeverijnenurinary tract infection antibiotic prophylaxis (y/n) incidence of urinary tract infection LegalBickeladmissiongenderdepartment LegalBlumedeath sentencerace of offenderrace of victim MedicalCharigsuccess removing kidney stones open surgery or percutaneous kidney stone diameter (<2cm) MedicalGatlingdeathinsulin dependent (y/n) age (<40) PsychologicalHandpercent maleyear (1970/1975)age (<65)
 race EpidemiologicalSeverijnenurinary tract infection antibiotic prophylaxis (y/n) incidence of urinary tract infection LegalBickeladmissiongenderdepartment LegalBlumedeath sentencerace of offenderrace of victim MedicalCharigsuccess removing kidney stones open surgery or percutaneous kidney stone diameter (<2cm) MedicalGatlingdeathinsulin dependent (y/n) age (<40) PsychologicalHandpercent maleyear (1970/1975)age (<65)")
15
Severijnen AJ, Verbrugh HA, Mintjes-de Groot AJ, Vandenbroucke- Grauls CMJE, van Pelt W. Sentinel System for nosocomial Infections in the Netherlands: A Pilot Study. Infect Control Hosp Epidemiol 1997; 18:818–824. Low incidence hospitalsUTINo UTI% with UTI Antibiotic Prophylaxis2010931.8 No Antibiotic Prophylaxis57150.7 High incidence hospitals Antibiotic Prophylaxis2214413.3 No Antibiotic Prophylaxis9914216.5 Combined Antibiotic Prophylaxis4212373.3 No Antibiotic Prophylaxis10421364.6

16
C. Morrell, Mathematical Science Department, Loyola College, Baltimore, MD CaucasiansMedical AidNo Medical Aid Rate of Medical Aid (%) Children not traced 1042282.5 Five-year group 10283.3 African Americans Children not traced 919578.7 Five-year group 363688.9 Combined Children not traced 19597916.6 Five-year group 4637011.1
 Children not traced Five-year group African Americans Children not traced Five-year group Combined Children not traced Five-year group")
17
Hand DJ. Psychiatric examples of Simpson's paradox. Br J Psychiat 1979;135: 90–1. Age < 65MaleFemalePercent Male Year 1970 25517459.4 Year 1975 15610260.5 Age >/= 65 Year 1970 8822228.4 Year 1975 8217531.9 Combined Year 1970 34339646.4 Year 1975 23827746.2

18
Cohen, M. R., and Nagel, E., 1934, An Introduction to Logic and Scientific Method, New York: Harcourt, Brace and Co. Death Rates from Tuberculosis in Richmond and New York City in 1910 CaucasiansDiedSurvived Death Rate per 100,000 (%) New York 8,3654,666,809178.9 Richmond 13180,764161.9 African Americans New York 51391,196559.4 Richmond 15546,578331.7 Combined New York 8,8784,758,005186.2 Richmond 286127,342224.1
 New York 8,3654,666, Richmond 13180, African Americans New York 51391, Richmond 15546, Combined New York 8,8784,758, Richmond ,")
19
Charig, C.R., Webb, D.R., Payne, S.R., Wickham, J.E. "Comparison of treatment of renal calculi by open surgery, percutaneous nephrolithotomy, and extracorporeal shockwave lithotripsy. Br Med J (Clin Res Ed) 292 (6524): 879–882. Kidney stones < 2cmsuccessfailure% successful Open81693 Percutaneous2343687 Kidney stones >= 2cm Open1927173 Percutaneous552569 Combined Open2737778 Percutaneous2896183
 292 (6524): 879–882. Kidney stones < 2cmsuccessfailure% successful Open81693 Percutaneous Kidney stones >= 2cm Open Percutaneous Combined Open Percutaneous")
20
Gatling W, Mullee MA, Hill RD. The general characteristics of a community based population. Practical Diabetes 1989; 5:104-7. Patients age <= 40DiedAlive% Died Insulin Dependent 11290.8 Non-Insulin Dependent 0150.0 Patients age > 40 Insulin Dependent 10412445.6 Non-Insulin Dependent 21831141.2 Combined Insulin Dependent 10525329.3 Non-Insulin Dependent 21832640.1

21
Blume JH, Eisenberg T, Wells MT; Explaining Death Row’s Population & Racial Composition; Scholarship@Cornell: A Digital Repository;3/1/2004. Indiana Death Sentence Rate Black victim Murders# of death sentences Death sentence rate Black offender2,151125.6 White offender10000 White victim Black offender3751642.7 White offender2,2724921.6 Combined Black offender2,5262811.1 White offender2,3724920.7

22
Bickel, PJ, Hammel, EA and O’Connell, JW. Sex Bias in Graduate Admissions: Data from Berkeley. Science 1975; 187: 398-403. OverallAdmittedApplicants Admittance Rate(%) Men 3715844244 Women 1513432135 Department A Men 51282562 Women 8910882 Department B Men 35356063 Women 172568
 Men Women Department A Men Women Department B Men Women")
23
Bickel, PJ, Hammel, EA and O’Connell, JW. Sex Bias in Graduate Admissions: Data from Berkeley. Science 1975; 187: 398-403. OverallAdmittedApplicants Admittance Rate(%) Men 3715844244 Women 1513432135 Department C Men 12132537 Women 20259334 Department D Men 13841733 Women 13237535
 Men Women Department C Men Women Department D Men Women")
24
Bickel, PJ, Hammel, EA and O’Connell, JW. Sex Bias in Graduate Admissions: Data from Berkeley. Science 1975; 187: 398-403. OverallAdmittedApplicants Admittance Rate(%) Men 3715844244 Women 1513432135 Department E Men 5419128 Women 9539324 Department F Men 172726 Women 243417
 Men Women Department E Men Women Department F Men Women")
25
Which statistical methods will “Lift the curtain of illusion to let the truth of my soul shine through*” regarding Simpson’s Paradox? Stratification Standardization Logistic regression * By Trudy Symeonakis Vesotksy

26
Definition of confounding Confounding/distortion can arise when two conditions are true: 1.The risk groups differ on the background factor/variable 2.The background factor/variable itself influences the outcome If you do not control for confounding, the unadjusted variables can be distorted/misleading Simpson’s Paradox is caused by confounding Anderson S, Auquier A, Hauck WW, Oakes D, Vandaele W, Weisberg, HI; 1980; Statistical Methods For Comparative Studies: Techniques For Bias Reduction; John Wiley & Sons; New York.

27
Beware the Lurking Variable: Understanding Confounding from Lurking Variables Using Graphs; Schield, Milo; STATS, Fall 2006, #46,14-18. The data below are an example of Simpson’s Paradox.

28
The combined overall death rate of 3.5% for the rural hospital versus 5.5% for the urban hospital is not a fair comparison as 30% of the rural hospital’s patients are in poor condition while 90% or the urban hospital’s patients are in poor condition. Let’s standardize the rates to make it a fair comparison. The standard population will consist of all the patients from both hospitals. The combined population consists of 800 patients in good condition and 1200 patients in poor condition (40% vs. 60%). The standardized death rate for the rural hospital would be (.02 X.40 +.07 x.60) =.008 +.042 =.05 = 5%. The standardized death rate for the urban hospital would be (.01 X.40 +.06 x.60) =.004 +.036 =.04 = 4%. With the death rates standardized, we see that the urban hospital has a lower death rate of 4% vs. 5% for the rural hospital! Dr. Schield then provides us with a graphic presentation.
. The standardized death rate for the rural hospital would be (.02 X x.60) = =.05 = 5%. The standardized death rate for the urban hospital would be (.01 X x.60) = =.04 = 4%. With the death rates standardized, we see that the urban hospital has a lower death rate of 4% vs. 5% for the rural hospital. Dr. Schield then provides us with a graphic presentation..")
29
Graphic Presentation of Simpson’s Paradox Let SRR = standardized rate rural, SRC = standardized rate city P= proportion of patients in poor condition in a standard population. SRR=(.07 X P) +.02 x (1 –P)= (.07-.02)P +.02 =.02 + (.05 x P) SRC=(.06 X P) +.01 x (1 –P)= (.06-.01)P +.01 =.01 + (.05 x P)
 +.02 x (1 –P)= ( )P +.02 =.02 + (.05 x P) SRC=(.06 X P) +.01 x (1 –P)= ( )P +.01 =.01 + (.05 x P).")
30
SAS code for logistic regression using Dr. Schield’s data. data simpsonsparadox; input condition hospital death numcell ; cards; 0 0 0 99 0 0 1 1 0 1 0 686 0 1 1 14 1 0 0 846 1 0 1 54 1 1 0 279 1 1 1 21 ; run; proc logistic data=simpsonsparadox descending; class condition hospital death / param=ref; model death=hospital condition; weight numcell; format condition condition. hospital hospital. death death.; title 'Data from Dr. Schield analyzed using logistic regression – Probability modeled is death = yes'; run;

31
Data from Dr. Schield analyzed using logistic regression

32
Simpson’s 2 nd Paradox Whether “the sensible interpretation” exists in the separate tables, or is instead found in the combined table, depends upon the context of the data being analyzed. This means that the correct interpretation cannot be reliably determined merely by looking at the numbers in the table. Suppose (hypothetical) data are analyzed to determine whether a new treatment (A) is superior to the standard treatment (B) for septic shock.
 data are analyzed to determine whether a new treatment (A) is superior to the standard treatment (B) for septic shock..")
33
Success of treatment for septic shock by diastolic blood pressure CombinedAliveDead% alive Treatment A86014086 Treatment B70030070 DBP < 50 Treatment A50 Treatment B250 50 DBP ≥ 50 Treatment A81090 Treatment B4505090

34
In the previous examples, a sensible interpretation has been found in the separate tables. Could it be that the separate tables are not showing the complete story for this situation? Suppose the facts regarding the data are: 2000 patients thought to have septic shock are randomized equally to Treatment A or Treatment B. The 2 groups have identical DBP distributions upon arrival at the Emergency Department. All patients survive the 1 st day. DBP is measured at the end of 24 hours of treatment and the DBP in the table is based upon this 2 nd measurement. Only one tenth (100/1000) of the Treatment A patients crash below 50. One half (500/1000) of the Treatment B patients crash below 50. The biology of the situation would suggest that the sensible interpretation is found in the combined table. Note that DBP was not a variable that was fixed at the start of the experiment but was an intermediate outcome affected by the treatment. If the variable is only on the causal pathway, it is not a confounder variable and you should not adjust for it.
 of the Treatment A patients crash below 50. One half (500/1000) of the Treatment B patients crash below 50. The biology of the situation would suggest that the sensible interpretation is found in the combined table. Note that DBP was not a variable that was fixed at the start of the experiment but was an intermediate outcome affected by the treatment. If the variable is only on the causal pathway, it is not a confounder variable and you should not adjust for it..")
35
Conclusions: Hopefully, the use of Simpson's Paradox will improve the learning experience for the students.

36
Facts are stubborn but statistics are more pliable.

37
There are 2 kinds of statistics- the kind you look up & the kind you make up.

38
Aaron Levenstein “Statistics are like a bikini. What they reveal is suggestive, But what they conceal is vital.”

39
Statistics can be used to support just about anything...

40
including statisticians!!

Similar presentations


>")


>")


 R-squared statistic (10.4.1) Residual plots (11.2) Influential observations (11.3, 11.4.3.>")


