Download presentation
Presentation is loading. Please wait.

1
IMPACT EVALUATION OF PERFORMANCE BASED CONTRACTING FOR A collaboration between the Ministry of Health, CNLS, SPH, INSP-Mexico and World Bank GENERAL HEALTH AND HIV/AIDS SERVICES IN RWANDA 1

2
7/2/2016 2 Presentation plan 1. Country Profile 2. Impact evaluation design 3. Results from the general health baseline and Follow up 4. Results from HIV baseline and Follow up studies 5. Discussion 2

3
Country Profile Total population: 9 millions 5 provinces and 30 Administrative districts Per Capita GNP: 250US $ 3 referral hospitals, 33 District Hosp., 369 Health centers Doctors: 1/50,000 inhabitants Nurses: 1/3,900 inhabitants; 17% of nurses in rural areas

4
NHA 2003 Rwanda Health Financing The average Rwandan lives on less than US$0.70 per day. Per capita annual health spending averages about US$14, with donors funding over 40%, government about one-third, and beneficiaries contributing roughly one-quarter

5
Trend of Maternal Mortality ratio Source : Demographic and Heath survey 1992, 2000 et 2005.

6
Infant and Under 5 mortality rate

7
SECTION 2 : Impact Evaluation Design 7

8
7/2/2016 8 Study Rationale No examples of rigorously evaluated bonus payment schemes to public sector health care providers in developing countries No distinction between the incentive effect and the effect of an increase in resources for the health facilities Link between worker motivation programs and quality of care 8

9
TRADITIONAL FINANCING VS PBF Traditional Way of Health financing in Rwanda was based on 3 sources of finance: GoR / Founders: Investment cost (Infrastructures & Equipment) GoR / Private / Population: Recurrent cost (salaries, drugs, materials, trainings,..) PBF: funds received for remuneration can be derived for enhancing human capacity building, HF materials, or any new strategy aiming at increasing quality.
 GoR / Private / Population: Recurrent cost (salaries, drugs, materials, trainings,..) PBF: funds received for remuneration can be derived for enhancing human capacity building, HF materials, or any new strategy aiming at increasing quality.")
10
7/2/2016 10 Hypotheses For both general health services and HIV/AIDS services, we will test whether PBC: Increases the quantity of contracted health services delivered Improves the quality of contracted health services provided Does not decrease the quantity or quality of non-contracted services provided, Decreases average household out-of-pocket expenditures per service delivered Improves the health status of the population 10

11
7/2/2016 11 Evaluation Design Make use of expansion of PBC schemes over time The rollout takes place at the District level Treatment and control facilities were allocated as follows: Identify districts without PBC in health centers in 2005 Group the districts in “similar sets” based on characteristics: rainfall population density livelihoods Flip a coin to assign districts within each “similar” to treatment and control groups. 11

12
12

13
7/2/2016 13 Roll-out plan Phase 0 districts (white) are those districts in which PBF was piloted Cyangugu = Nyamasheke + Rusizi districts Butare = Huye + Gisagara districts BTC = Rulindo + Muhanga + Ruhango + Bugesera + Kigali ville Phase 1 districts (yellow) are districts in which PBF is being implemented in 2006, following the ‘roll-out plan’ Phase 2 districts (green) are districts in which PBF is not yet phased in; these are the so-called ‘Phase 2’ or ‘control districts’ following the roll-out plan. According to plan, PBF will be introduced in these districts by 2008. 13

14
Baseline Health Facility Sample Phase I (Intervention district) Phase II (Control districts) DistrictTotal FacilitiesDistrictTotal Facilities Kibungo11Kirehe10 Nyanza2Kamonyi9 Gakenke11 Rwamagana3Nyagatare13 Gatsibo8 Kayonza11 Nyamasheke2Karongi17 Ngororero6 Rutsiro10Nyabihu10 Nyaruguru9Nyamagabe13 Burera10Musanze11 Total83Total83 TOTAL 166 HEALTH FACILITY
 Phase II (Control districts) DistrictTotal FacilitiesDistrictTotal Facilities Kibungo11Kirehe10 Nyanza2Kamonyi9 Gakenke11 Rwamagana3Nyagatare13 Gatsibo8 Kayonza11 Nyamasheke2Karongi17 Ngororero6 Rutsiro10Nyabihu10 Nyaruguru9Nyamagabe13 Burera10Musanze11 Total83Total83 TOTAL 166 HEALTH FACILITY")
15
Rollout plan for PBC in HIV/AIDS services 15

16
7/2/2016 16 Program Implementation Timeline 16

17
Quality assurance in comparisons Law of large numbers does not apply here… Proposed solution: Propensity scores matching of communities in treatment and comparison based on observable characteristics Over-sample “similar” communities in Phase I & Phase II It turned out Couldn’t find enough characteristics to predict assignment to Phase I Took a leap of faith and did simple stratified sampling 17

18
More money vs. More incentives Incentive based payments increase the total amount of money available for health center, which can also affect services Phase II area receive equivalent amounts of transfers average of what Phase I receives Not linked to production of services Money to be allocated by the health center Preliminary finding: most of it goes to salaries 18

19
The baseline has 4 surveys General Health facility survey (166 centers) General Health household survey ( 2,016 HH) HIV/AIDS facility survey (64 centers) HIV/AIDS household survey (1994 HH) 19
 General Health household survey ( 2,016 HH) HIV/AIDS facility survey (64 centers) HIV/AIDS household survey (1994 HH) 19")
20
Baseline Field Sampling: GH HH Randomly selected FOUR CELLS per HF Done in SPH using Epi Info and given to team leaders Randomly selected THREE ZONES per cell Done by GH HH team leader in field Obtained household lists for each of the zones and randomly selected ONE HOUSEHOLD per zone Done by GH HH team leader in field with zone/village leader Random sample of 12-13 households with children < 6 years old per HF 2,159 households.

21
Baseline Field Sampling: GH HH HEALTH FACILITY CELL 1 HH 1HH 2HH 3 CELL 2 HH 4HH 5HH 6 CELL 3 HH 7HH 8HH 9 CELL 4 HH 10HH 11HH 12

22
Validity of Sample Require two different validations: Validate the sampling for the evaluation design Diff in means tests between Phase I and Phase II to determine if intervention and comparison groups balanced at baseline Validate the quality of data Compare descriptive stats to other sources of national data (i.e.: 2005 & 2007 DHS, MOH data)
")
23
7/2/2016 23 Analysis Plan All analyses will be clustered at the district level Compare the average outcomes of facilities and individuals in the treatment group to those in the control group 24 months after the intervention began. Use of multivariate regression (or non-parametric matching) : control confounding factors Test for differential individual impacts by: Gender, poverty level Parental background (If infant : maternal education, HH wealth) 23
 : control confounding factors Test for differential individual impacts by: Gender, poverty level Parental background (If infant : maternal education, HH wealth) 23.")
24
7/2/2016 24 Difference in differences models To test the robustness of the analysis Control sample (both observed and unobserved) heterogeneity A two-way fixed effect linear regression: 24
 heterogeneity A two-way fixed effect linear regression: 24")
25
SECTION 3 : Descriptive Results from General Health Baseline 25

26
GENERAL HEALTH FACILITIES BASELINE SURVEY 26

27
27 General Health Centers Survey: Content All 166 centers in General Health General characteristics Human resources module: Skills, experience and motivations of the staff Services and pricing Equipment and resources Vignettes: Pre-natal care, child care, adult care VCT, PMTCT, AIDS detection services Exit interviews: Pre-natal care, child care, adult care, VCT, PMTCT

28
Classification of facility 28

29
Baseline Health Facility: Main sources of revenue

30
Baseline Health Facility: Human Resources On average: 1 doctor for every 31,190 individuals, 1 nurse for every 4,835 individuals 30

31
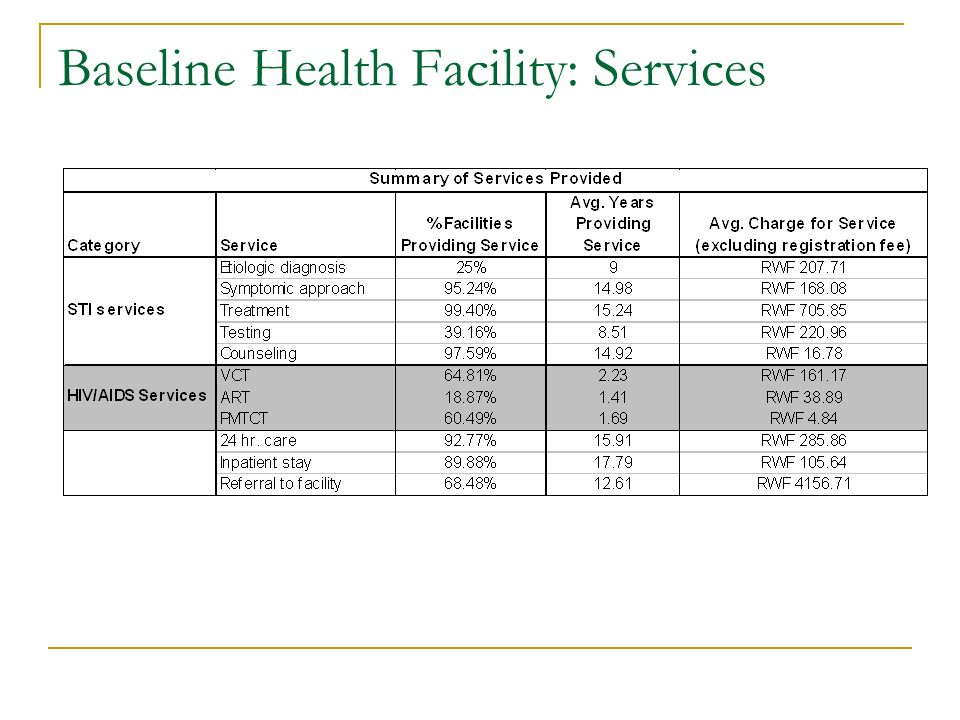
Baseline Health Facility: Services

33
Baseline Health Facility: Lab Tests

34
Baseline Health Facility: Utilization

35
Baseline Health Facility: Overall Patient Satisfaction

36
Baseline Household Sample 2159 HH, 10,880 individuals Average HH size is 5.71 individuals, 75% of the sample is under the age of 30 years old. (Sampling strategy) Not a nationally representative sample: Sample of rural households with children < 6 years old
 Not a nationally representative sample: Sample of rural households with children < 6 years old.")
37
Baseline Household Data: Education 37

38
Baseline Household Data: Assets

39
Baseline Household Data: Activities of Daily Living (21+ years)
")
40
Baseline Household Data: Prenatal Care 40

41
Baseline Household Data: Prenatal Care

42
Baseline Household Data: Child Immunization 42

43
Baseline Household Data: Child Recent Illness and Symptoms (<6 years)
")
44
Baseline Household Data: Child Health Care Utilization (<6 years)
")
45
Baseline Household Data: Child Biomarkers (<6 years)
")
46
Validity of Sample and Data 46 Evaluation design Of 110 key characteristics and output variables of HF, the sample is balanced on 104 of the indicators. Of 80 key HH output variables, the sample is balanced on 73 of the variables. Quality of data HH Results comparable to the 2005 DHS, MOH data

47
Follow-up Field Sampling: GH HF Return to 166 facilities Some GH facilities began offering HIV/AIDS services (VCT, PMTCT and/or ARV) between 2006-2008 Identified in the field and used the HIV/AIDS HF questionnaire; all GH HF questions still asked but in different format 94 (56.63%) GH 2006 & 2008 60 (36.14%) GH 2006; HIV/AIDS 2008 12 (7.23%) incomplete information as of Sept. 2008 Use same provider id codes Print baseline roster (names, codes) and keep consistent across waves Account for personnel who left and new hires from 2006- 2008
 and keep consistent across waves Account for personnel who left and new hires from")
48
Follow-up Field Sampling: GH HH Objective: Return to the same households to create panel data set (2006-2008) Print baseline roster (names, codes) and keep consistent across waves Account for household members who left and new arrivals from 2006-2008
 Print baseline roster (names, codes) and keep consistent across waves Account for household members who left and new arrivals from")
49
Follow-up Field Sampling: GH HH Result: In total 2159 were suppose to be surveyed in the catchment area of 167 facilities. 1888 (87%) were interviewed in 2006 and 2008 267 (12%) were replaced 4 (0.2%) were not found and not replaced % of replacement by region: South (24%), North (14%), East (4%) and West (13 %)
 were interviewed in 2006 and 2008 267 (12%) were replaced 4 (0.2%) were not found and not replaced % of replacement by region: South (24%), North (14%), East (4%) and West (13 %).")
50
Follow-up Field Sampling: GH HH External reasons: Migration result of 1) avoiding Gacaca, 2) employment in Kigali, 3) famine in South during the last 2 years Decentralization in 2006 renamed some areas in study sample; impossible to locate based on baseline location Internal reasons: For some health facilities, the baseline HH team didn’t follow sampling procedure Given a cell to survey by the SPH team but difficult to reach Used the same cell information but surveyed households in another area Health facilities with 10-13 hh replaced
 avoiding Gacaca, 2) employment in Kigali, 3) famine in South during the last 2 years Decentralization in 2006 renamed some areas in study sample; impossible to locate based on baseline location Internal reasons: For some health facilities, the baseline HH team didn’t follow sampling procedure Given a cell to survey by the SPH team but difficult to reach Used the same cell information but surveyed households in another area Health facilities with hh replaced")
51
Follow-up Field Sampling: GH HH WHAT DOES THIS MEAN FOR ANALYSIS? Restrict to only matched households? 1,888 households Restrict to matched households at baseline plus replacements in follow-up? Baseline: 1,888 matched households Follow-up: 1,888 matched households + 267 replacements

52
Timeline of Activities Key points for GH analysis Baseline: Collected prior to training or first payments. Follow-up: The MOH initiated a revised training course for ALL districts in 2008. Phase I districts received March-April 2008, and Phase II districts received in May 2008 May look at indicators up to March 2008 for all health facilities as health facility data collection didn’t end until July 2008

53
HIV HEALTH FACILITIES BASELINE SURVEY 53

54
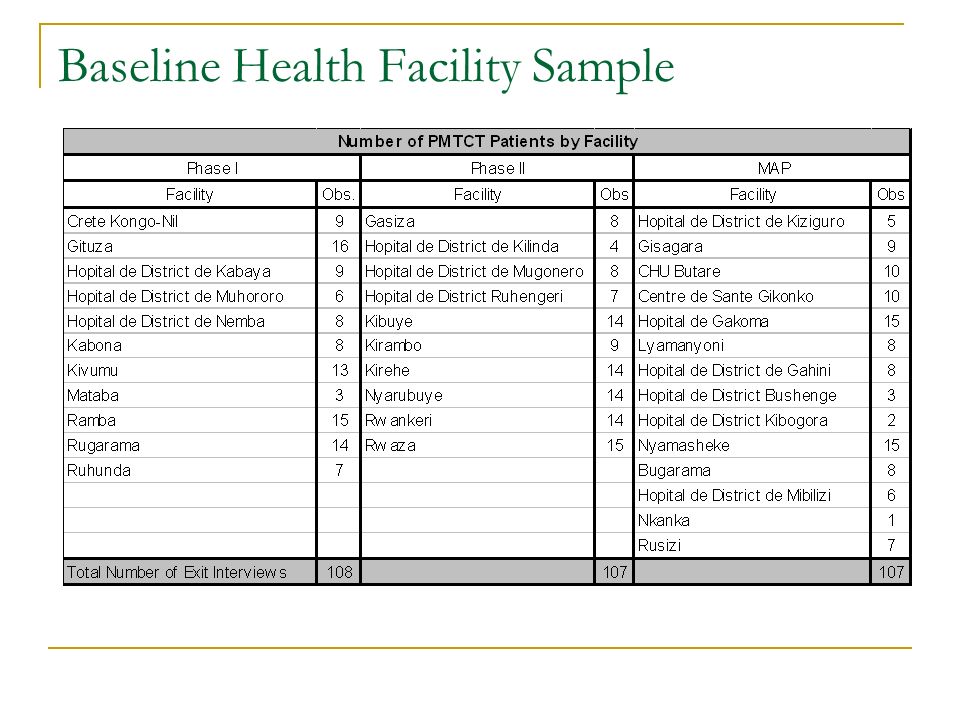
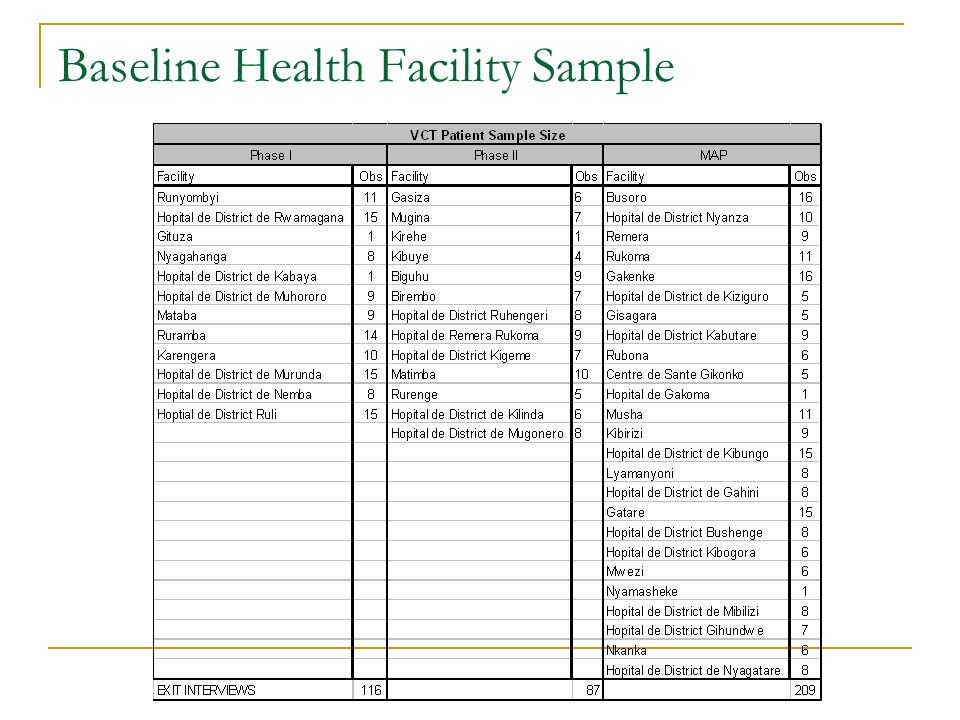
Baseline Health Facility Sample

57
Baseline Household Sample 38 ARV facilities for household sampling 13 MAP; 10 Phase I; 15 Phase II ARV sites for HH sampling Original sample of 1,487 patients from health facilities and associations Final sample consists of 1,961 households and 7,494 individuals

58
Household Level: Sample Size of Patients We find there is an additional sample of individuals in our household sample who self- report HIV+ status Based on this, final distribution of patients:

59
Baseline Health Facility: Main sources of revenue

60
Baseline Health Facility: HIV/AIDS Human Resources 60

61
Baseline Health Facility: Services

62
Baseline Health Facility: Utilization

63
Baseline Health Facility: Overall Patient Satisfaction

64
Baseline Household Sample: Demographics

65
HIV Patients vs. Non-Patients: Time Allocation

66
HIV Patients vs. Non-Patients: Mortality in the Household

67
Patients vs. Non-Patients: Mortality in the Household in the last 5 years

68
HIV Patients vs. Non-Patients: Health Care Utilization

69
HIV Patients vs. Non-HIV Patients: Health Care Utilization Days unable to perform normal duties as result of illness Patients: 20.88 Non-Patients: 7.7

70
Patients vs. Non-Patients: Sexual Behavior

71
Validity of Sample and Data 71 Evaluation design Of 330 key characteristics and output variables of HF, the sample is balanced on 94% of the indicators. Of 150 HH key characteristics, the sample is balanced on 77% of the variables. Quality of data HH Results comparable to the 2005 DHS, MOH data

72
Follow-up Field Sampling: HIV HF Return to 64 facilities Some GH facilities began offering HIV/AIDS services (VCT, PMTCT and/or ARV) between 2006-2008 Identified in the field and used the HIV/AIDS HF questionnaire; all GH HF questions still asked but in different format In 2008, should have 101 facilities 43 facilities are HIV in 2006 & 2008 21 overlap HIV & GH in 2006 & 2008 37 NEW overlap HIV & GH in 2008 Have data for 95 facilities Missing CHU – dropped from MAP sample Biguhu and Kibuye HC - in GH data set? Kabaya, Muhororo, Birembo - ?

73
Follow-up Field Sampling: HIV HH Objective: Return to the same households to create panel data set (2006-2008) Print baseline roster (names, codes) and keep consistent across waves Account for household members who left and new arrivals from 2006-2008
 Print baseline roster (names, codes) and keep consistent across waves Account for household members who left and new arrivals from")
74
Follow-up Field Sampling: HIV HH Result: In total 1996 were to be surveyed in the catchment area of 38 ARV facilities. 1,716 (87.06%) were interviewed in 2006 and 2008 280 (12.94%) were not found and not replaced % of missing by region: South (12.6%), North (12.7%), East (7%) and West (16.4%)
 were interviewed in 2006 and 2008 280 (12.94%) were not found and not replaced % of missing by region: South (12.6%), North (12.7%), East (7%) and West (16.4%).")
Similar presentations


 Making Cents / Youth Economic Opportunities Conference 12 September 2012 EPAG Impact Evaluation:>")


 Sarah Bales Public Policy in Asia,>")

 and Orphans and Vulnerable Children (OVC)>")
 UNIVERSITY OF NAIROBI, KENYA RUSINGA DSS ON THURSDAY 12 TH MARCH 2015.>")


