Download presentation
Presentation is loading. Please wait.

1
From the Trenches OHVCMG May 13, 2010 Richard S. Ralston Antarctica

2
SMF Buffers Interesting word – Assume Several occurrences of lost SMF data in 2009 Guess who got to fix the problem? Initially had a small SMF Buffer space and small CIsize

3
SMF Buffers – Do You Have Enough? Watch and track data from your type 23 records. 2 types of records SMF dataset switch 15 minute SMF status records **** Make sure you have current SMF maintenance Use either 1/3 or ½ track CIsize For high activity LPARs use 1 gig buffer space For other LPARs the type 23s will provide clues to determine buffer space https://www.ibm.com/developerworks/wikis/display/z osperfinstr/Home

4
Console Messages *IEE986E SMF HAS USED 50% OF AVAILABLE BUFFER SPACE Messages start at 50% 1 message for every 1% increase Messages stop when decreasing and reaches 50%

5
Type 23 Status Record 15 minute interval record Contains: SMF23BFANumber of Buffer Allocation Requests SMF23BFH High Water Mark of Storage Allocation SMF23BFWNumber of SMF Buffers Written SMF23BFT Total Buffer Storage Allocated SMF23SUS Number of SMF Buffer Suspensions SMF23BFL Percent Buffer Usage Warning Level Reqs SMF23RCWSMF Records Written Amongst other things.

6
Issue SMF gets bent out of shape if a big bunch of (>2000?) big records hit it within 1 second followed by continued high SMF activity. Normally (98+% of the time) SMF handles all records in 8 meg of buffers. When ‘bent’, SMF gets buffers in 8 meg increments but may only use 1 buffer from each increment. Possible to ‘use up’ all buffer space in a matter of seconds Handful of APARs on this, all improve the situation, but it is not completely eliminated. Use SMF23BFH to determine how big to make SMF Buffer Space, max is 1 gig
 SMF handles all records in 8 meg of buffers. When ‘bent’, SMF gets buffers in 8 meg increments but may only use 1 buffer from each increment. Possible to ‘use up’ all buffer space in a matter of seconds Handful of APARs on this, all improve the situation, but it is not completely eliminated. Use SMF23BFH to determine how big to make SMF Buffer Space, max is 1 gig.")
7
Hit 92% of Available Buffer Space

8
Buffers vs. SMF Records

9
Buffer Turnover

10
SMF/Buffer

11
Bytes Written

12
Buffer Memory Used Tracking SMF23BFH and SMF23BFT

13
Ultimate Cause? 3521 SMF records written at 9:00:01 3230 were 110-2 Event Duration: 13:30 – long 50% buffer full: 9:07:49 92% buffer full: 9:13:31 70916 total records Type 14: 9509 Type 30: 2369 Type 42: 4930 Type 101: 12,856 Type 110: 12,793 Type 115: 5029 Type 254: 12,714 (IDMS) Plenty of CPU, CPC: 40%, LPAR 20% Cause: Still Unknown – I/O Issues? 60,200 records, 84.9% of total
 Plenty of CPU, CPC: 40%, LPAR 20% Cause: Still Unknown – I/O Issues. 60,200 records, 84.9% of total.")
14
Different Time, Different LPAR December 27 - 04:06:51 Hit 82% buffer full – 1 gig buffer space 10 Test DB2 regions shutdown at the same time Solution: stagger DB2 shutdowns by 1 minute

15
Buffer Memory Used

16
CICS Record Compression Compresses 110 records as they are written Does not reduce the number records Does reduce the number of SMF buffers written Can be turned on dynamically

17
CICS Record Compression CICS Record Compression Turned On

18
DB2 ACCUMAC DB2 accounting data for DDF and RRSAF threads is accumulated by end user Default: ACCUMAC=10 Was set to NO on ASG’s recommendation Currently testing

19
SMF Logger Intended to fix SMF data loss problems Gets better with each z/OS release Move to it when you think its ready

20
Hiperdispatch On z10s Intended to reduce internal overheads Cache refreshes, fetchs MP effect Dynamically changes CPU assignments to LPARs Provides CPU affinity to CICS, DB2, IDMS, etc. address spaces Recommendation, use it for all LPARs with 3 or more CPs Note: I’m using it on all LPARs, anyway. Cathy Walsh’s recommendation

21
What It Does Parks (pseudo varies offline) CPs, zIIPs, & zAAPs not used in an LPAR Always keep 2 of each unparked Good thing, reduces MP effect Only Low Share polarity engines can be parked. Dynamically provides processors in 3 polarity catagories High Share polarity – dedicated, 100% used by LPAR Medium Share polarity – Approximately 50% per LPAR Low Share polarity – Minimal use, these may be parked Good thing, minimizes cache refreshes Changes dynamically based upon dynamic LPAR weighting factor Provides CP affinity for high CPU workloads (CICS, DB2, etc) Reduces Level 1 and 1.5 cache refreshes
 Reduces Level 1 and 1.5 cache refreshes.")
22
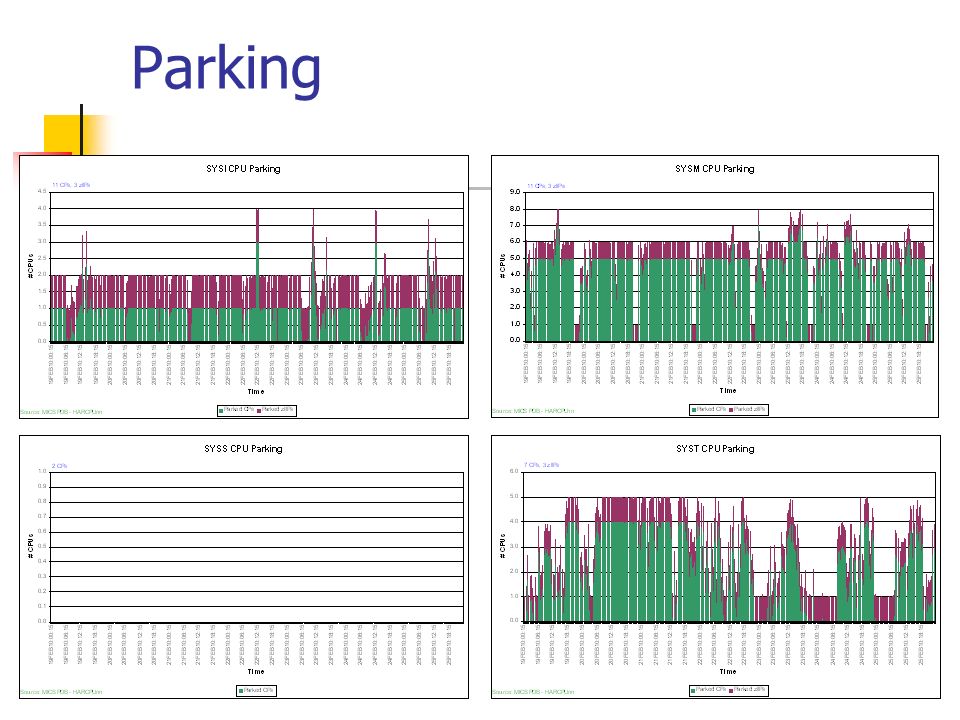
Parking To determine the amount of time parked, look at IPUPTM in the type 70s for each processor. Sum them by processor type, CP, zIIP, zAAP to get total parked time per type for the 15 minute interval. MICS HARCPU: CPUTOPTM, CPUSUPTM, CPUZPPTM MXG TYPE70: CPUPATxx, CPUPATTM, SMF70PAT Divide by the interval duration to determine how many processors were parked during the interval.

23
Parking

25
In TMONMVS, the CPU Activity Display will show which logical processors are parked. They will show 100% CPU Utilization and 0% Dispatch Utilization. This applies to CPs, zIIPs, And zAAPs.

26
Parking Different LPAR. Notice the parked zIIP is the middle zIIP. The zAAP is not parked because there must be at least 3 processors (zAAPS in this case) available in order for parking to be used.
 available in order for parking to be used..")
27
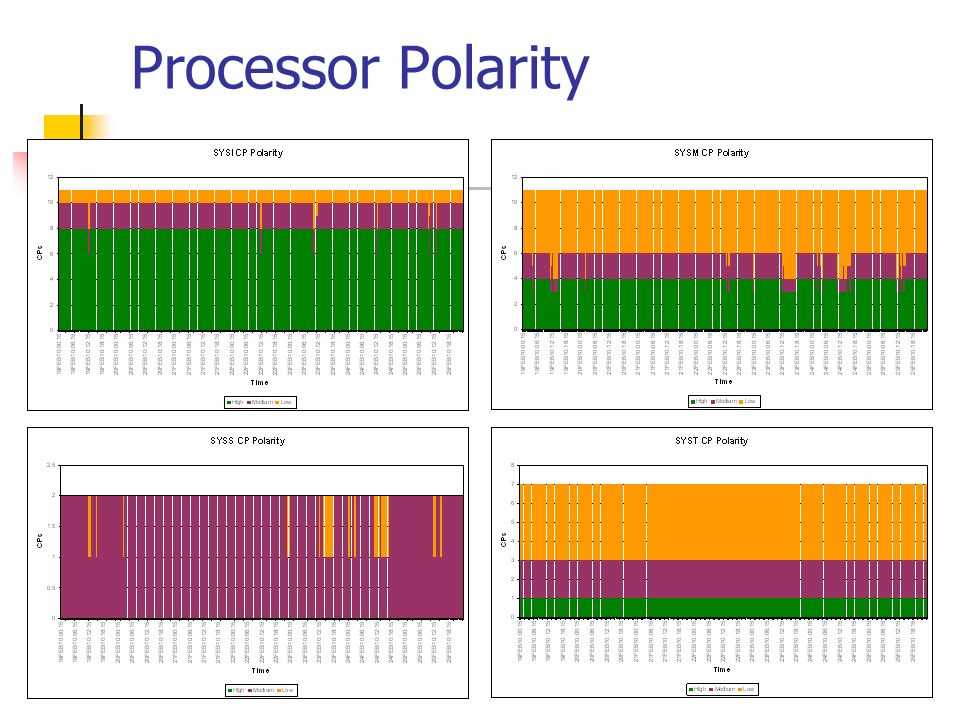
Processor Polarity This one’s nastier to report/track. RMF/PM and RMF Data Portal provide this information in a nice usable form. Based on bit values in SMF70POF. MICS converts this to data in HARIPU. Count of intervals of high, medium, low share for each processor type. Also in HARCPU CPs: CPUAVTHP, CPUAVTMP, CPUAVTLP zIIPS: CPUAVSHP, CPUAVSMP, CPUAVSLP zAAPs: CPUAVZHP, CPUAVZMP, CPUAVZLP In MXG TYPE70PR has a new field called POLARITY and a format, MG070PO, for that field.

28
Processor Polarity

30
Processor Polarity - RMF PM RMF PM has data elements defined to display the high share, medium share, low share CPs. These windows are updated every minute.

31
CP Polarity – Normal

32
CP Polarity – Group Capped

33
Data Visualization A picture is worth 1000 words 3 great books Show Me the Numbers: Designing Tables and Graphs to Enlighten, Stephen Few, Analytics Press, 2004, ISBN: 978-0970601995 Information Dashboard Design: The Effective Visual Communication of Data, Stephen Few, O’Reilly Media, 2006, ISBN: 978-0596100162 Now you see it: Simple Visualization Techniques for Quantitative Analysis, Stephen Few, Analytics Press, 2009, ISBN: 978-0970601988

34
2010 Convert my SAS/Graph stuff to v9.2 – 50% completed Use SAS/Graph v9.2 to create KPI dashboard z/VM and z/LINUX performance reporting and capacity planning CPU Measurement Facility (type 113 records)
")
35
Future Work/Desire – Fun Stuff We are using SAS on AIX for BI work. I want to take specific type 70, 71, 72 data, extract it and place on the AIX SAS server. Then use the SAS data miner to find the chalk the cheese. How does the performance data relate to each other? I did brief similar experiment at Whirlpool in 2002 using the IBM Data Miner.

36
Contact me rralston@humana.com 502-476-1121 Cyclotourist@bellsouth.net Facebook & LinkedIn rsrcyclotourist@gmail.com

Similar presentations