Download presentation
Presentation is loading. Please wait.

1
Biodiversity -What is Biodiversity? -Calculating Biodiversity

2
What is Biodiversity? Well lets break the word biodiversity down Bio: Life Diversity: Having Variety Scientists use biodiversity to examine, predict, and increase the health of an environment.

3
Biodiverse Ecosystems What are the components of biodiversity in an ecosystem? Variety of: Plants Animals Fungi Insects Bacteria Many species, many traits, many varieties An ecosystem that has a high level of diversity is a system that can support itself, stay healthy, and be resistant to changes within the entire environment.

4
How Does a Rain Garden Increase Biodiversity? A rain garden increases biodiversity by increasing the species richness of an ecosystem. Scientists will use a specific equation to measure the amount of biodiversity, species evenness and species richness within a rain garden. To the right this is what a typical rain garden looks like. Lets explore how to measure and use the biodiversity equation.

5
How do Scientists Measure Biodiversity How do we measure biodiversity? Species Richness: The total number of species in an area. Must count and then add them up. Species Evenness: How are the entire amount of species represented in the area (are most of the species the same?). Simpson’s Index: This index is found by taking species richness and species evenness and converting it into one number.
. Simpson’s Index: This index is found by taking species richness and species evenness and converting it into one number..")
6
Calculations

7
Example Time! In a rain garden there are many species of organisms. Species A has 13 individual organisms, Species B has 4, Species C has 8, Species D has 5, and Species E has 9. Step 1 Put data in to a Chart SpeciesNumber of a Particular Species (n) A13 B4 C8 D5 E9
 A13 B4 C8 D5 E9.")
8
Speciesnn-1n(n-1) Species A1313-1=1213(13-1)=156 Species B44-1=34(4-1)=12 Species C88-1=78(8-1)=56 Species D55-1=45(5-1)=20 Species E99-1=89(9-1)=72 316
 Species A1313-1=1213(13-1)=156 Species B44-1=34(4-1)=12 Species C88-1=78(8-1)=56 Species D55-1=45(5-1)=20 Species E99-1=89(9-1)=72 316")
9
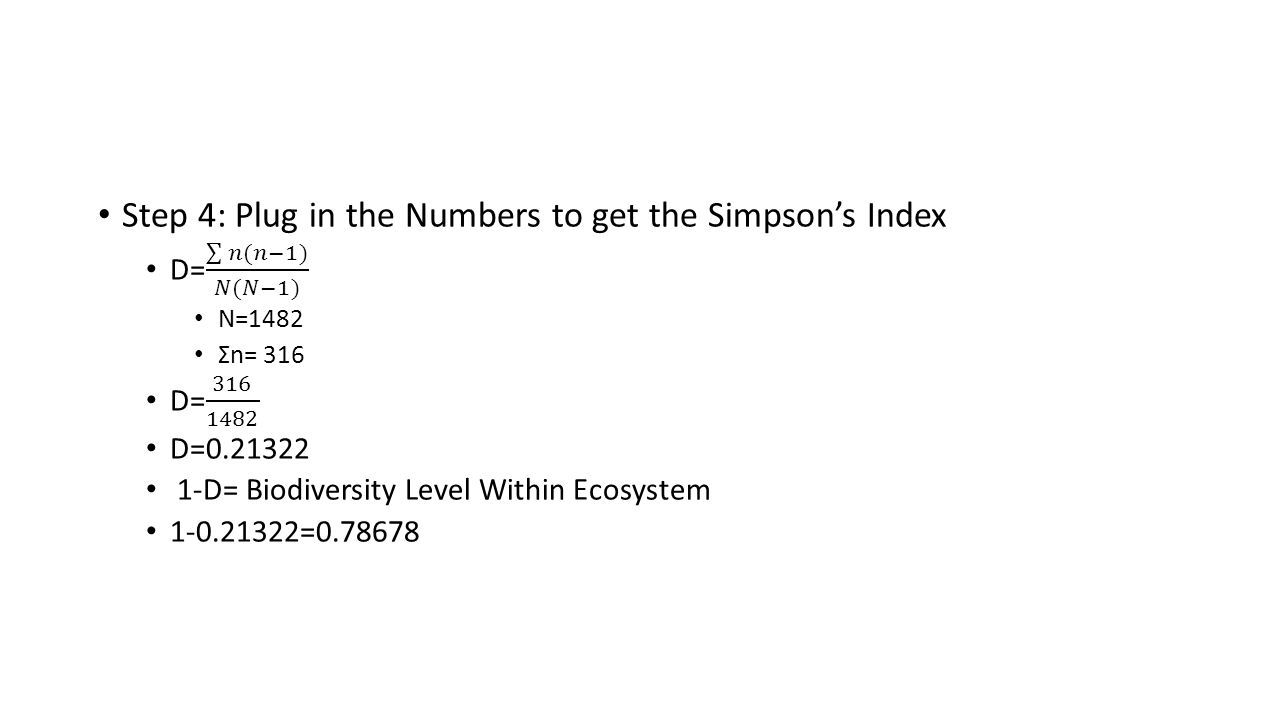
Speciesn A13 B4 C8 D5 E9 N39

11
Step 5: Analysis of Simpson’s Index Simpson’s Index ranges from 0-1 0 limited biodiversity in an area 1 high biodiversity in an area Our number is 0.7753 We have a high level of biodiversity within our sample area.

Similar presentations


 Students know different kinds of organisms.>")


