Download presentation
Presentation is loading. Please wait.

1
Selecting The Ideal Option Strike Price Using Fibonacci Part II – October 1 st, 2015

2
PART II – October 1st, 2015 Fibonacci Strategies For Trading Options

3
Fib Review Retracements – Projects a current corrective wave by analyzing a adjacent trend wave External retracements / Extensions – Projects a current trend wave by analyzing the adjacent corrective wave Projections – Projects a current trend wave by analyzing the adjacent corrective wave AND the prior trend.

4
Fibonacci Time Analysis

5
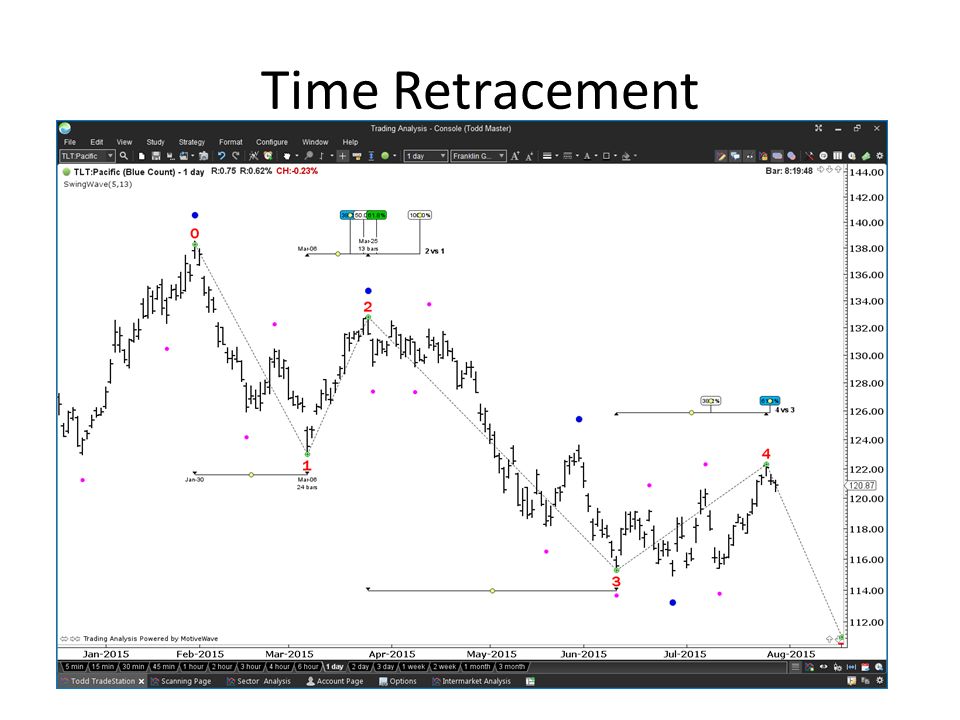
We spend countless hours looking at the vertical Y-axis searching for price levels to buy and sell. For the spot, stock, or futures traders this is fine, but for the option trader, we are missing a key component –TIME. Knowing not only where to place a trade (Y- axis), but WHEN to place the trade for what duration can make a huge difference in the outcome of the trade.
, but WHEN to place the trade for what duration can make a huge difference in the outcome of the trade..")
6
The Tools of Fibonacci Time Analysis Time Retracement Time Extension Time Projection Alternate Time Projection Ratios to use – 38.2%, 61.8%, 78.6%, 100%, 127.2%,161.8%, 200%, 261.8%, 423.6%

7
Time Retracement

9
Time Projection

10
Time Projection + Extension

11
Time Projection + Extension + Projection 2

12
Time Projection

13
Time Projection + Extension

14
Time Projection + Extension + Projection

15
Option Deltas The amount an option is expected to move given a $1.00 move in the underlying stock. For example, take a Facebook Aug 95 call with a delta of 0.60 trading at $6.25. The underlying stock is trading at $97.00. If Facebook rallies from $97.00 to $98.00 that Aug 95 call will rally by $0.60 and should now trade at $6.85

16
Option Deltas Puts have negative deltas GLD Aug 102 puts are trading for $0.64 with a delta of - 0.23 with the underlying stock trading at $105.15. If the stock drops $1.00 to $104.15 the Aug 102 puts, though still out of the money, are now trading for $0.87. Delta can be looked at as the % chance that option will expire in the money, though there is debate about this definition. Delta can also be looked at as an aggregate figure to predict your account PnL with a $1.00 move in the underlying

17
Option Delta

18
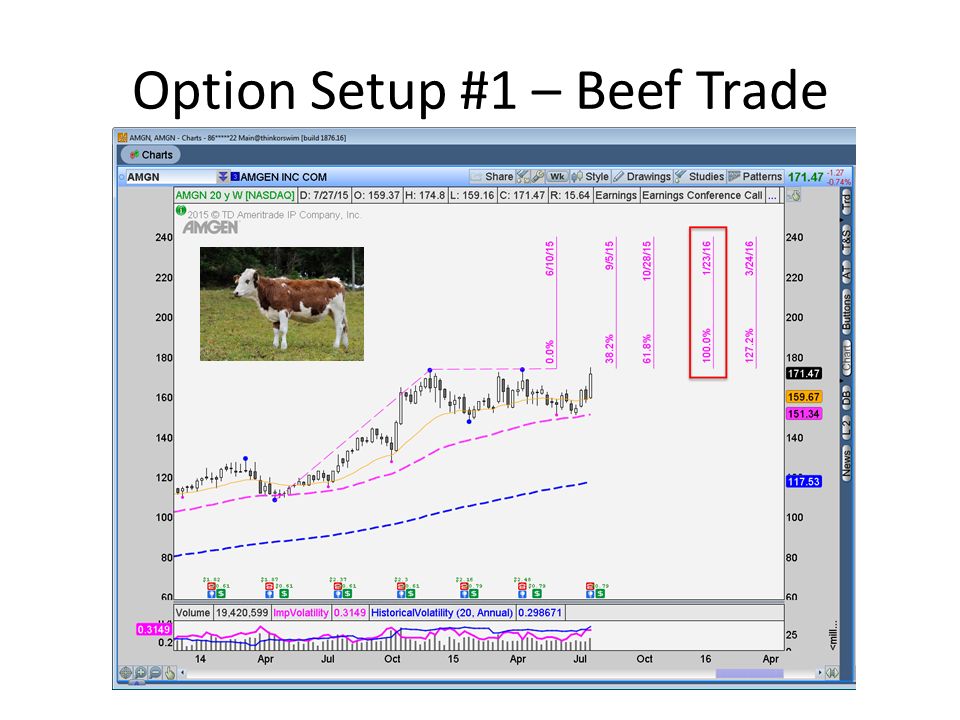
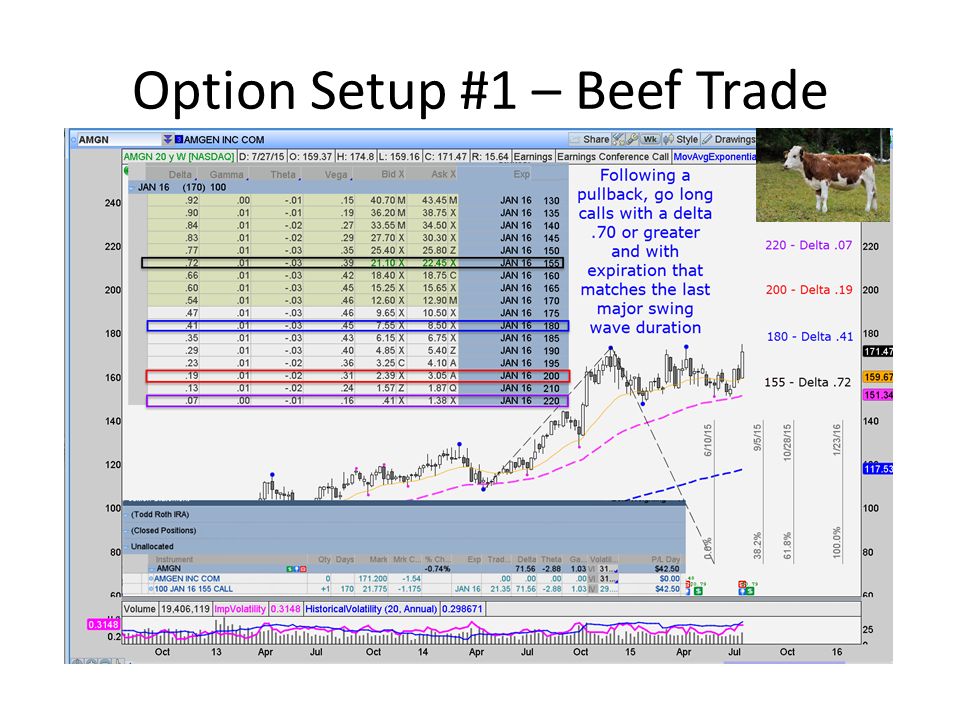
Option Setup #1 – Beef Trade

21
Theta / Time Decay

22
Theta - Time Decay Theta is one of the Greeks. It’s a dollar figure that represents how much premium you will lose per day by holding a long position in that option. Or, how much you’ll earn by being short.

23
Time Decay

24
Short Dated and Long Dated Option Theta

25
Standard Deviation – Probabilities on your side

26
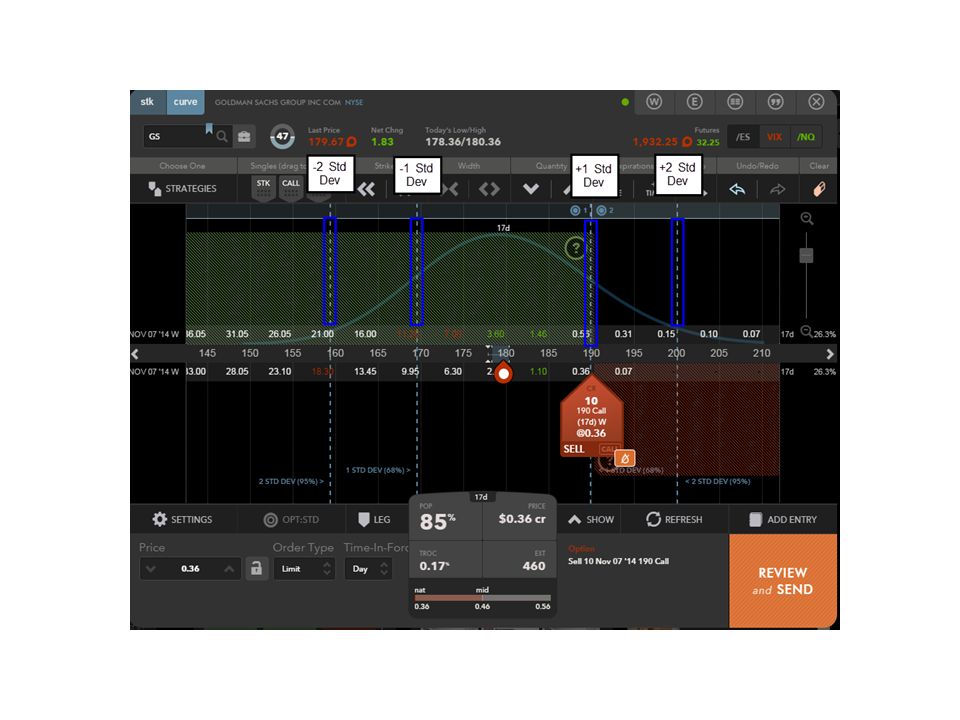
Short +1 Standard Deviation Call

28
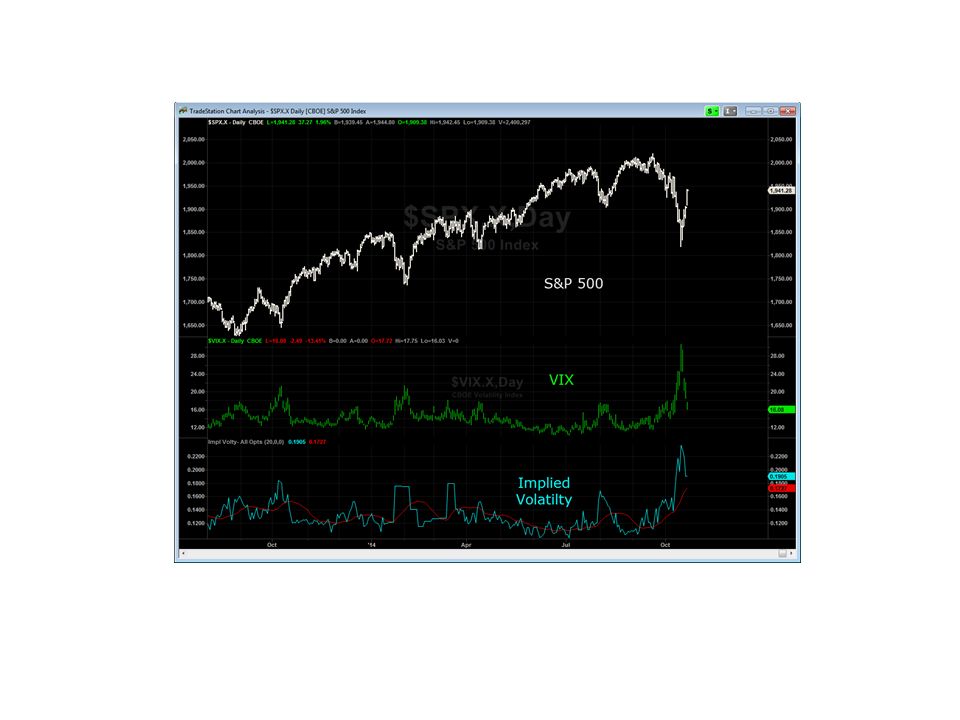
What is Volatility?

30
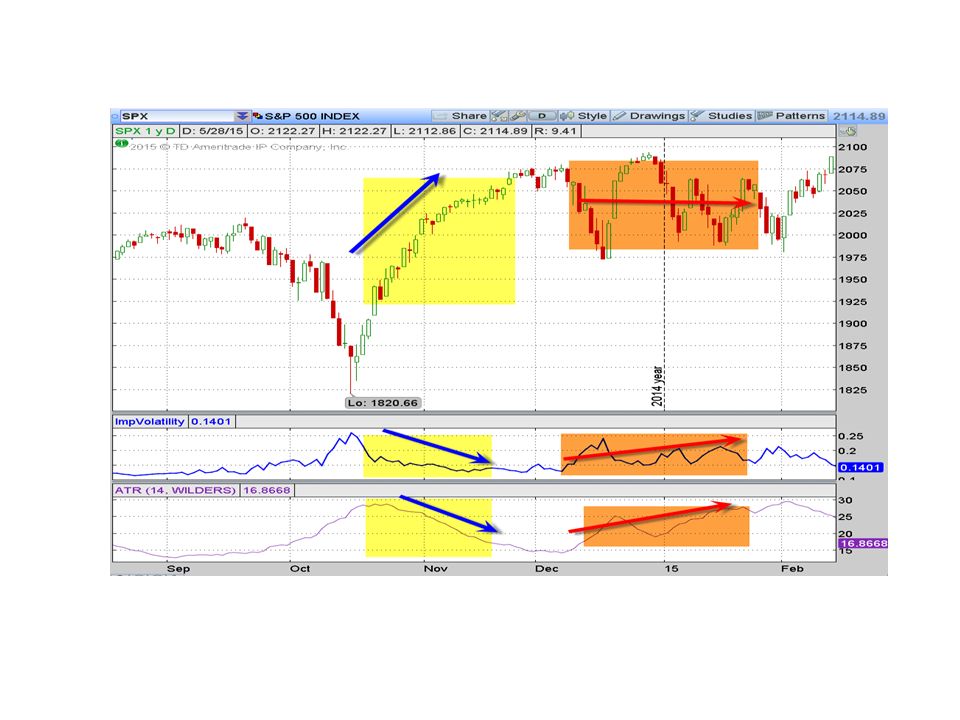
Implied Volatility Implied volatility fluctuates quite rapidly as a percentage basis, which cannot go negative. The higher implied volatility is, the greater perceived movement there is in a stock The higher implied volatility, the MORE expensive BOTH puts AND calls become Implied volatility is mean-reverting, meaning it does NOT trend. You can range trade implied volatility, unlike a stock price which can and often does TREND The idea is to sell overbought implied volatility, and buy oversold implied volatility…

31
Google Implied Volatility Around Earnings

32
Overbought / Oversold Implied Volatility

35
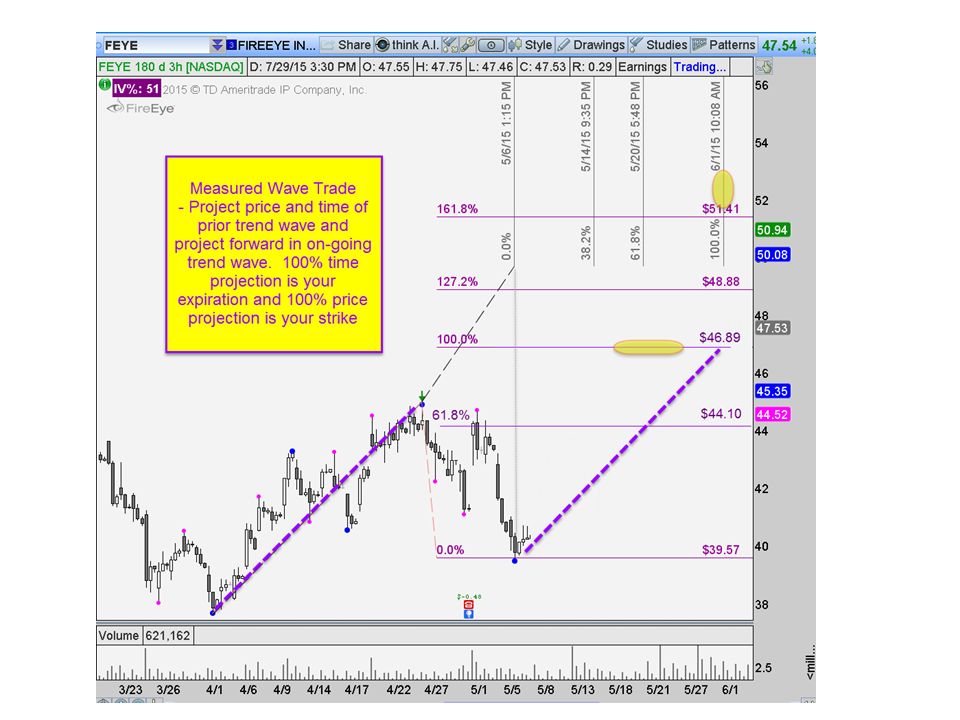
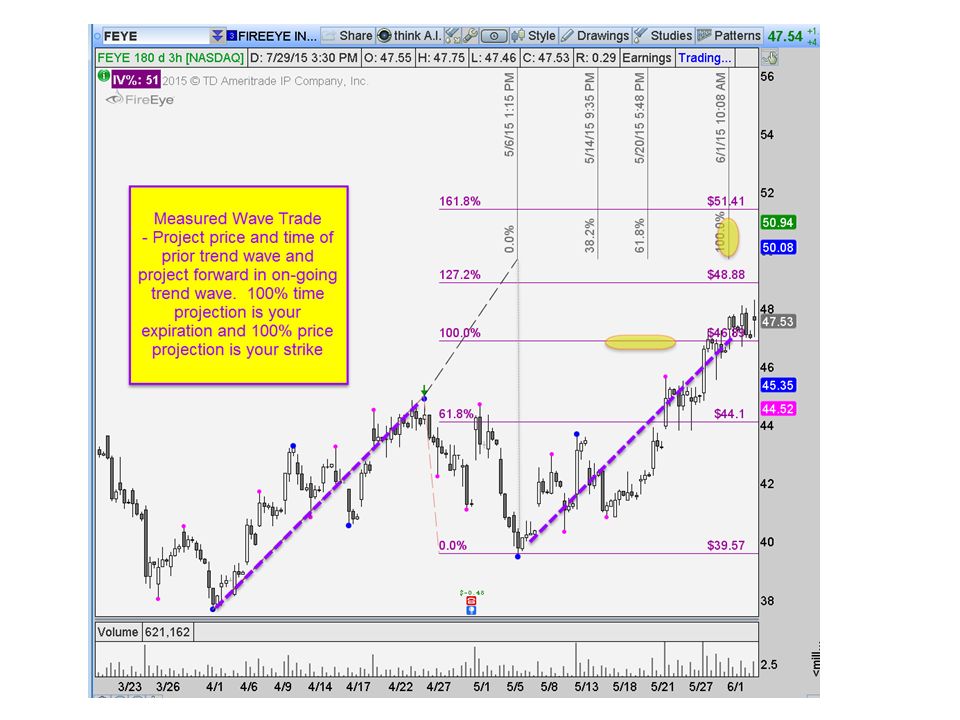
Trade Setup #2 – Measured Waves Trade 1.Isolate a trend 2.Wait for the trend to exhaust itself and begin to pullback 3.Identify the most recent MAJOR swing wave high. Use the highest swing wave 4.Find the most recent MAJOR swing wave low 5. Using your Fibonacci retracement tool, click the earlier swing wave and then the latter swing wave to draw the retracement levels 6.Monitor the pullback looking for swing waves against your retracement levels – these serve as entries*

38
Measured Wave Trade with IV Filter The current reading of the implied volatility will determine how you execute this trade. An implied volatility percentile of less than 50% suggests its better to use a long PREMIUM strategy. – For longs buy a nearby call, then sell a further out of the money call – If you are right on a directional basis those puts will become further in the money increasing the delta – Expectation is low implied volatility will revert to the mean and increase, thus raising the value of all options a double kicker

39
Measured Waves with Low IV

40
Measured Waves Trade with IV Filter The current reading of the implied volatility will determine how you execute this trade. An implied volatility percentile of greater than 50% suggests its better to use a SHORT PREMIUM strategy. – For longs short a nearby put, then buy a further out of the money put. – If you are right on a directional basis those puts will become further out of the money – Expectation is high implied volatility will revert to the mean and drop, thus dropping the value of all options a double kicker

41
Measured Wave With High IV

42
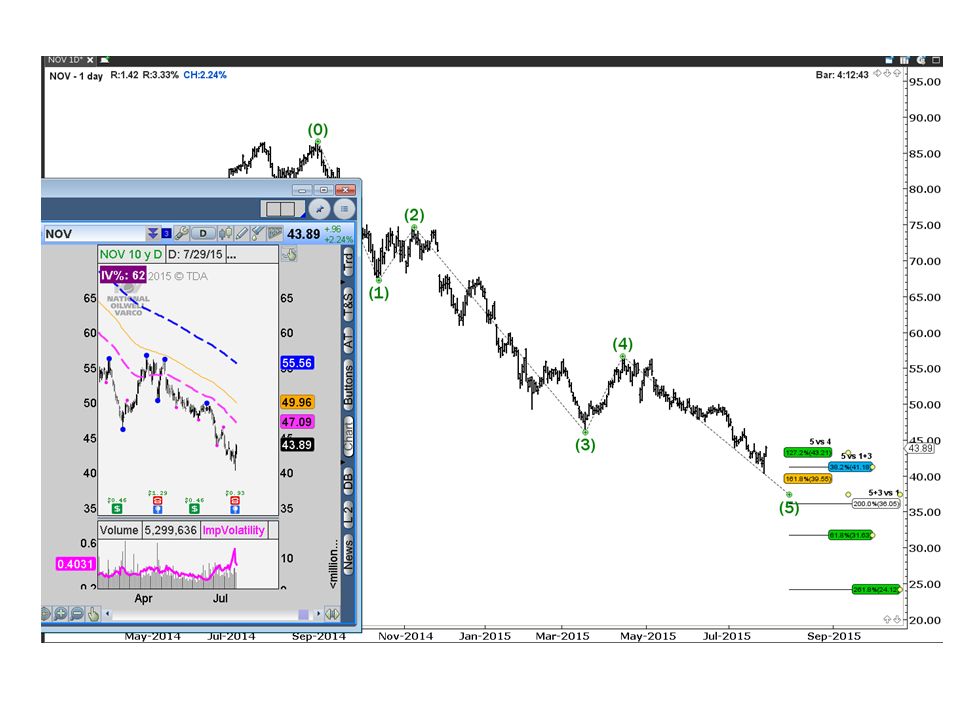
Trade Setup #3 – Trend Fade Identify a 5-wave bull or bear trend Look for a 200% - 261.8% projection of wave 1 projected up from wave 2. Look for a 38.2% - 61.8% projection of waves 1 through 3 projected up from wave 4 Look for a 127.2% - 161.8% projection of wave 4 up to wave 5.

43
Trade Setup #3 – Trend Fade Identify a 5-wave bull or bear trend

44
Trade Setup #3 – Trend Fade Identify a 5-wave bull or bear trend

45
Trade Setup #3 – Trend Fade Identify a 5-wave bull or bear trend

46
Look for a 200% - 261.8% projection of wave 1 projected up from wave 2. Trade Setup #3 – Trend Fade

47
Look for a 38.2% - 61.8% projection of waves 1 through 3 projected up from wave 4

48
Trade Setup #3 – Trend Fade Look for a 38.2% - 61.8% projection of waves 1 through 3 projected up from wave 4 Look for a 127.2% - 161.8% extension of wave 4 up to wave 5

49
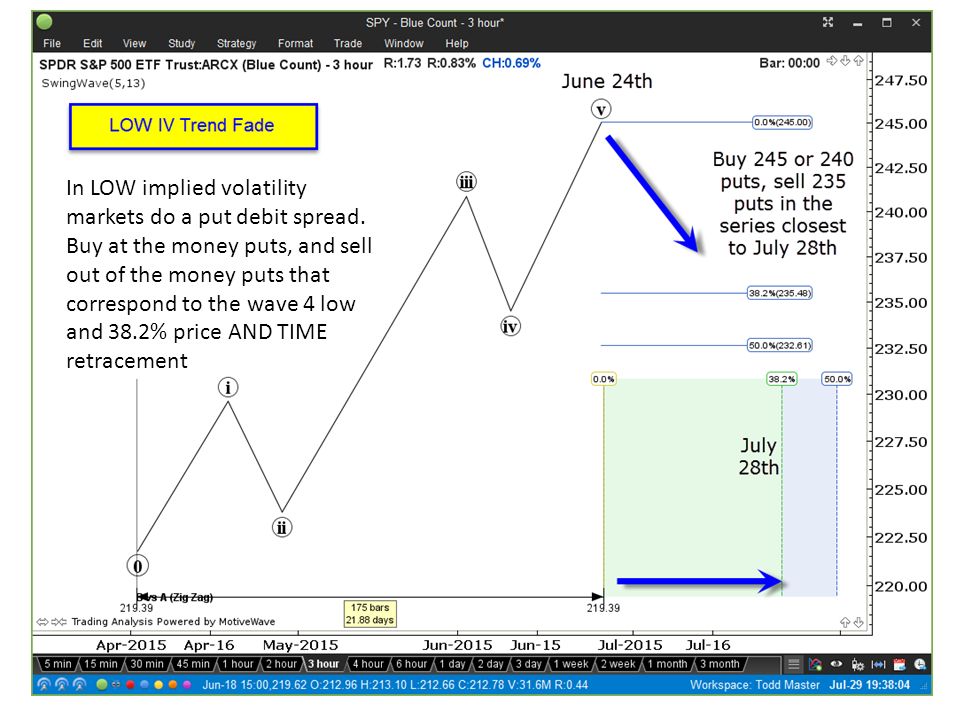
Trade Setup #3 – Trend Fade In LOW implied volatility markets do a put debit spread. Buy at the money puts, and sell out of the money puts that correspond to the wave 4 low and 38.2% price AND TIME retracement

51
Trade Setup #3 – Trend Fade In HIGH implied volatility markets do a call credit spread. Sell ATM or slightly OTM calls, and buy further OTM calls that is above your Fib resistance zone, or 1 standard deviation away from current price. Trade the strike nearest to 45 days until expiration

53
The 1 standard deviation move is $5.23. Subtract that from current price and you have $38.66. Sell a Sept $40 put, buy a Sept $35 put for a credit of $0.67.

54
GOLD Membership The Chart Room – All The Markets We’re Currently Following Todd’s Man Cave – Daily Blog Update With Charts When & Where to EXECUTE Your Trade SMS Alerts To Any Country Daily Video Outlining The Setups Chart Setups that Keep It Simple JUST $197 Trading Analysis Premier -$7.00 renewing at $177 Trading Service http://tradinganalysis.com/premier Or Call 859-963-3445

55
END OF PRESENTATION Trade the strike nearest to 45 days until expiration

Similar presentations
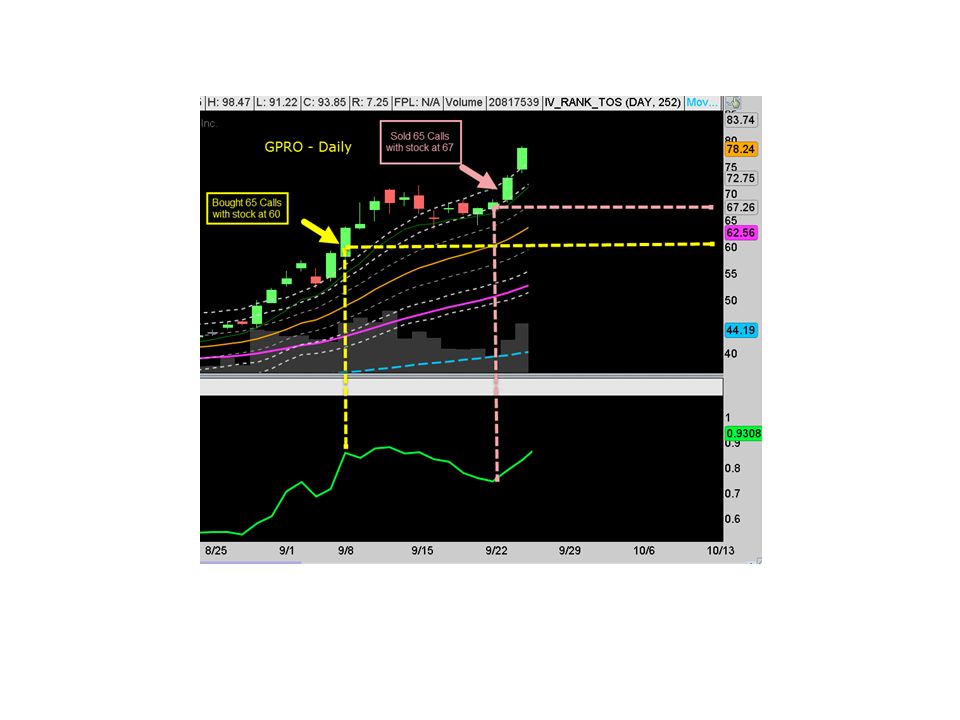


 -Debit Spread -Shorter Term Trade (1 – 3 weeks before.>")


