Download presentation
Presentation is loading. Please wait.

1
FAA Projects High Altitude Airspace Analysis software isa

2
“In the future we will be able to use much larger control volumes than the present sector-based system” High Altitude Airspace Concept Mid-term (2003-2007) operational concept Improved data availability Satellite CNS capabilities Enhanced decision making aids Consider using (much) larger control volumes above a given flight level (say FL350)
 operational concept Improved data availability Satellite CNS capabilities Enhanced decision making aids Consider using (much) larger control volumes above a given flight level (say FL350)")
3
Respect existing center boundaries to assure full CNS capability center physically attached to CNS resources (not flexible) Create a single Super-high Service Volume (SSV) for each center in the CONUS Analyze the characteristics of each SSV on the basis of representative indicators traffic load / demand conflict load analysis conflict characteristics conflict likelihood High Altitude Airspace Concept - Analysis “As a first look at the concept, take the ‘sector as big as a center’ statement literally ”
 Create a single Super-high Service Volume (SSV) for each center in the CONUS Analyze the characteristics of each SSV on the basis of representative indicators traffic load / demand conflict load analysis conflict characteristics conflict likelihood High Altitude Airspace Concept - Analysis As a first look at the concept, take the ‘sector as big as a center’ statement literally")
4
NAS using 20 Super-high Service Volumes (SSV) FL350 & Above
 FL350 & Above")
5
Simulate the High Level Airspace using traffic typical of today’s NAS with many active SUA (worst-case) and high-level sectors replaced by SSV Produce statistical measures to evaluate load and demand in each SSV indication of the complexity of each SSV suitability indicators for introduction of SSV in region High Altitude Airspace Analysis: Study Objectives “It is not the objective to provide a new airspace design”
 and high-level sectors replaced by SSV Produce statistical measures to evaluate load and demand in each SSV indication of the complexity of each SSV suitability indicators for introduction of SSV in region High Altitude Airspace Analysis: Study Objectives It is not the objective to provide a new airspace design")
6
Using RAMS Plus ATC Simulator (v3.1) Airspace: 20 Super-high Service Volumes (SSV) 1 SSV per US Center FL350 – FL550 Standard NAS Rules: 5NM Lateral 5NM Longitudinal 2000ft Vertical High Altitude Special Use Airspace Active Traffic: 48 hours traffic (Sept 20 th /21 st 2000) ETMS flight plan data Trajectory calculated using RAMS Plus performance model All National, International and GA flights using FL350 or above Cleaned in RAMS Plus Super-high Service Volume: Simulation Characteristics Note: Fixed operational procedures or LOA’s were not modelled
 Airspace: 20 Super-high Service Volumes (SSV) 1 SSV per US Center FL350 – FL550 Standard NAS Rules: 5NM Lateral 5NM Longitudinal 2000ft Vertical High Altitude Special Use Airspace Active Traffic: 48 hours traffic (Sept 20 th /21 st 2000) ETMS flight plan data Trajectory calculated using RAMS Plus performance model All National, International and GA flights using FL350 or above Cleaned in RAMS Plus Super-high Service Volume: Simulation Characteristics Note: Fixed operational procedures or LOA’s were not modelled")
7
24010 Flights (48 hours) - Analysis of Core Period Super-high Service Volume: Core Traffic Load Period
 - Analysis of Core Period Super-high Service Volume: Core Traffic Load Period")
8
Traffic Load number of active flights in SSV in a 15-min period Traffic Demand number of flights entering SSV in a 15-min period Conflict Load number of conflicts in the region in a 15-min period Super-high Service Volume: Load Indicators

9
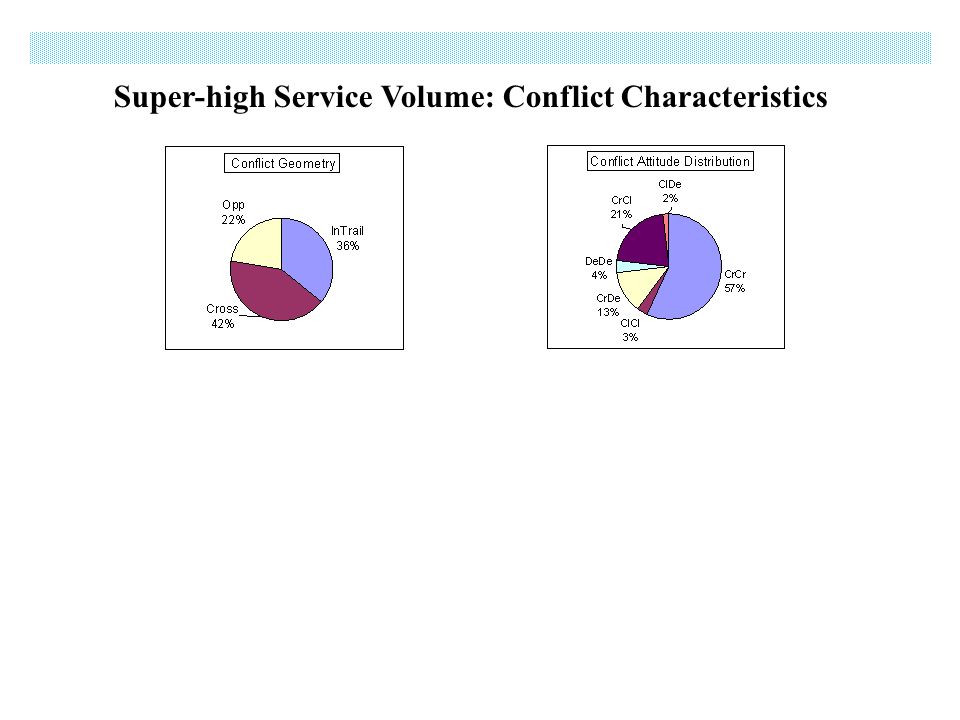
Conflict Characteristics Conflict Geometry Configuration of Aircraft in Conflict Conflict Likelihood Relationship between Active Flights and Conflicts Super-high Service Volume: Complexity Indicators No attempt to use a “magic formula” to assess complexity – just basic measures and simple relationships

10
Described as a pair of time-lines for each 15-min measure Super-high Service Volume: Traffic Load / Traffic Demand

11
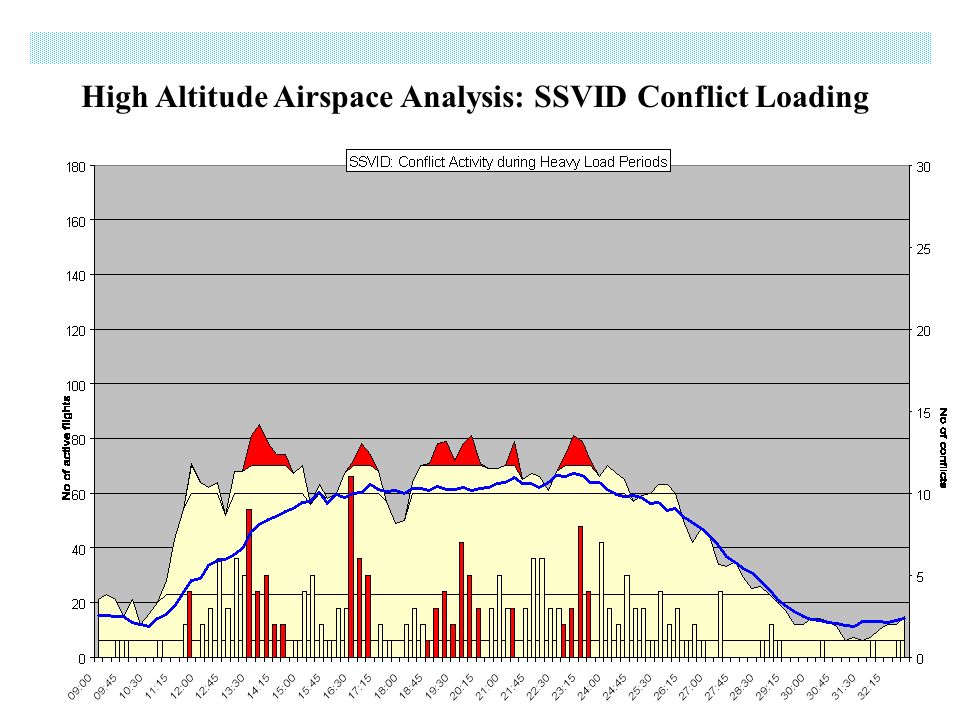
Super-high Service Volume: Traffic/Conflict Load High load indicator when load is in the top 25% busiest 15-min periods for SSV plot traffic load

12
Super-high Service Volume: Traffic/Conflict Load plot traffic load add conflict load Conflict load indicator also shown in red for high load periods

13
Super-high Service Volume: Traffic/Conflict Load plot traffic load add conflict load NAS average traffic load (for reference)
")
14
Super-high Service Volume: Conflict Characteristics

17
Using 15-min Traffic Load (x-axis) Super-high Service Volume: Conflict Likelihood and Conflict Load (y-axis)
 Super-high Service Volume: Conflict Likelihood and Conflict Load (y-axis)")
18
Using 15-min Traffic Load (x-axis) Super-high Service Volume: Conflict Likelihood and Conflict Load (y-axis) Create a scatter plot
 Super-high Service Volume: Conflict Likelihood and Conflict Load (y-axis) Create a scatter plot")
19
Super-high Service Volume: Conflict Characteristics Using 15-min Traffic Load (x-axis) and Conflict Load (y-axis) Create a scatter plot To determine relationship between traffic load and possible conflict. Produce “best-fit” curve(s)
.")
20
High Altitude Airspace Analysis: ~Results Indicators generated for each SSV in the NAS Considered by (5) Geographical Region(s) Comparison between separate SSV avoided except for some inter-SSV comparison for same region Looking for regions where SSV may be interesting low load, evenly balanced, few conflicts… and Regions which may have to be further sub-divided high load/demand, uneven balance, many conflicts …
 Geographical Region(s) Comparison between separate SSV avoided except for some inter-SSV comparison for same region Looking for regions where SSV may be interesting low load, evenly balanced, few conflicts… and Regions which may have to be further sub-divided high load/demand, uneven balance, many conflicts …")
21
High Altitude Airspace Analysis: West-Coast SSVs

22
High Altitude Airspace Analysis: West-Central SSVs

23
High Altitude Airspace Analysis: Central SSVs

24
High Altitude Airspace Analysis: Southern SSVs

25
High Altitude Airspace Analysis: East-Coast SSVs

26
High Altitude Airspace Analysis: Example Results Presentation of 2 contrasting SSV’s from the simulation SSVDV (Large West-Central SSV) SSVID (Central region) Details of other SSVs can be found in final report
 SSVID (Central region) Details of other SSVs can be found in final report")
27
High Altitude Airspace Analysis: SSVDV Traffic Loading

28
High Altitude Airspace Analysis: SSVDV Conflict Loading

29
High Altitude Airspace Analysis: SSVDV Conflict Characteristics

30
High Altitude Airspace Analysis: SSVDV Conflict Likelihood

31
High Altitude Airspace Analysis: SSVID Traffic Loading

32
High Altitude Airspace Analysis: SSVID Conflict Loading

33
High Altitude Airspace Analysis: SSVID Conflict Characteristics

34
High Altitude Airspace Analysis: SSVID Conflict Likelihood

35
Additional Study Exercise (DRVSM) Consider the effect of Domestic RVSM operations Same Traffic & Airspace Additional Flight Levels above FL295 “Equitable Distribution of Traffic between new FL’s Flights using ‘even’ FL’s (e.g. 310, 350…) 50% up to next FL above (i.e. Original FL + 1000ft) 50% down to next FL below (i.e. Original FL - 1000ft) Flights using ‘odd’ FL’s (e.g. 330, 370…) 50% remain at Original FL 25% up to next FL above (i.e. Original FL + 2000ft) 25% down to next FL below (i.e. Original FL - 2000ft)
 50% up to next FL above (i.e. Original FL ft) 50% down to next FL below (i.e. Original FL ft) Flights using ‘odd’ FL’s (e.g. 330, 370…) 50% remain at Original FL 25% up to next FL above (i.e. Original FL ft) 25% down to next FL below (i.e. Original FL ft).")
36
Simulate Same 24010 Flights (48 hours) Additional Study Exercise (DRVSM)
 Additional Study Exercise (DRVSM)")
37
DRVSM Scenario: SSVDV Traffic Loading

38
CVSM Scenario: SSVDV Conflict Loading

39
DRVSM Scenario: SSVDV Conflict Loading

40
DRVSM Scenario: SSVDV Conflict Characteristics

41
High Altitude Airspace Analysis: SSVDV Conflict Likelihood

42
DRVSM Scenario: SSVID Traffic Loading

43
High Altitude Airspace Analysis: SSVID Conflict Loading

45
DRVSM Scenario: SSVID Conflict Characteristics

46
High Altitude Airspace Analysis: SSVID Conflict Likelihood

47
High Altitude Airspace Analysis: Summary First look at the concept: Already provides very interesting results Indicators are representative of the various regions Some areas seem very suitable for SSV Some may be more interesting if sub-divided Some areas risk never being suitable (under current traffic situations) DRVSM is very promising for use of large control volumes
 DRVSM is very promising for use of large control volumes")
48
High Altitude Airspace Analysis: Future Work RAMS Plus <> Air MIDAS Study Integrating a behavioral/cognitive model of the air traffic controller into the simulated world Study to assess how many flights the controller may realistically handle Assessment of maximum volume size that can realistically be used in a given upper airspace region For further information on RAMS Plus <> Air Midas, Diana Liang at FAA or Kevin Corker at SJSU

Similar presentations


. Statistics graph Data recorded in surveys are displayed by a statistical graph. There are some specific.>")


![Copyright 2008 : ISA Software NAS-Wide Simulation Capabilities [RAMS Plus, CHILL/SIM-C] GMU – December 2008.](/18/6202345/big_thumb.jpg "Copyright 2008 : ISA Software NAS-Wide Simulation Capabilities [RAMS Plus, CHILL/SIM-C] GMU – December 2008.>")

 techniques requires gaining.>")
