Download presentation
Presentation is loading. Please wait.

1
Lophelia is a “foundation species” for a whole community of organisms. Living in Lophelia’s Neighborhood

2
Why do organisms live together in a community? Shelter / protection To find mates / reproduction Food Let’s explore these food relationships

3
Using your prior knowledge, construct a food web of the Lophelia community. Lophelia Fish Sponge Crab Hydroid s Soft Coral with Brittle Star

4
How do you determine who eats whom? For example, how would you figure out what this crab eats? 1)Observation Watch the crab to see what it eats. Tools: o swim/scuba gear (in shallow water) o Waterproof camera o Time-lapse camera But what if you never saw the crab eating?
Observation Watch the crab to see what it eats. Tools: o swim/scuba gear (in shallow water) o Waterproof camera o Time-lapse camera But what if you never saw the crab eating .")
5
2) Collection collect the crab physically examine it’s gut content But … what if the crab chewed its food really well? Or what if it had not eaten in a while? Or what if it was a very small animal with an even smaller stomach? How do you determine who eats whom?

6
3) Morphology (studying the form or shape of an organism) Infer what the crab eats based on the form and structure of its mouth and body For example, the pinchers are probably good for grabbing prey or picking food off substrates. But, morphology does not tell you the specific species eaten. How do you determine who eats whom?

7
What about small animals like hydroids? What do they eat? Too small to watch Too small to examine gut contents Can infer they eat very small organisms, but what? Hydroids catch small primary producers (like bacteria) or small primary consumers (like zooplankton) using the stinging cells (called nematocysts) in their tentacles.
 or small primary consumers (like zooplankton) using the stinging cells (called nematocysts) in their tentacles..")
8
Often scientists use all three methods (observation, collection and morphology) and still there are food webs that are difficult to study. We need another tool!

9
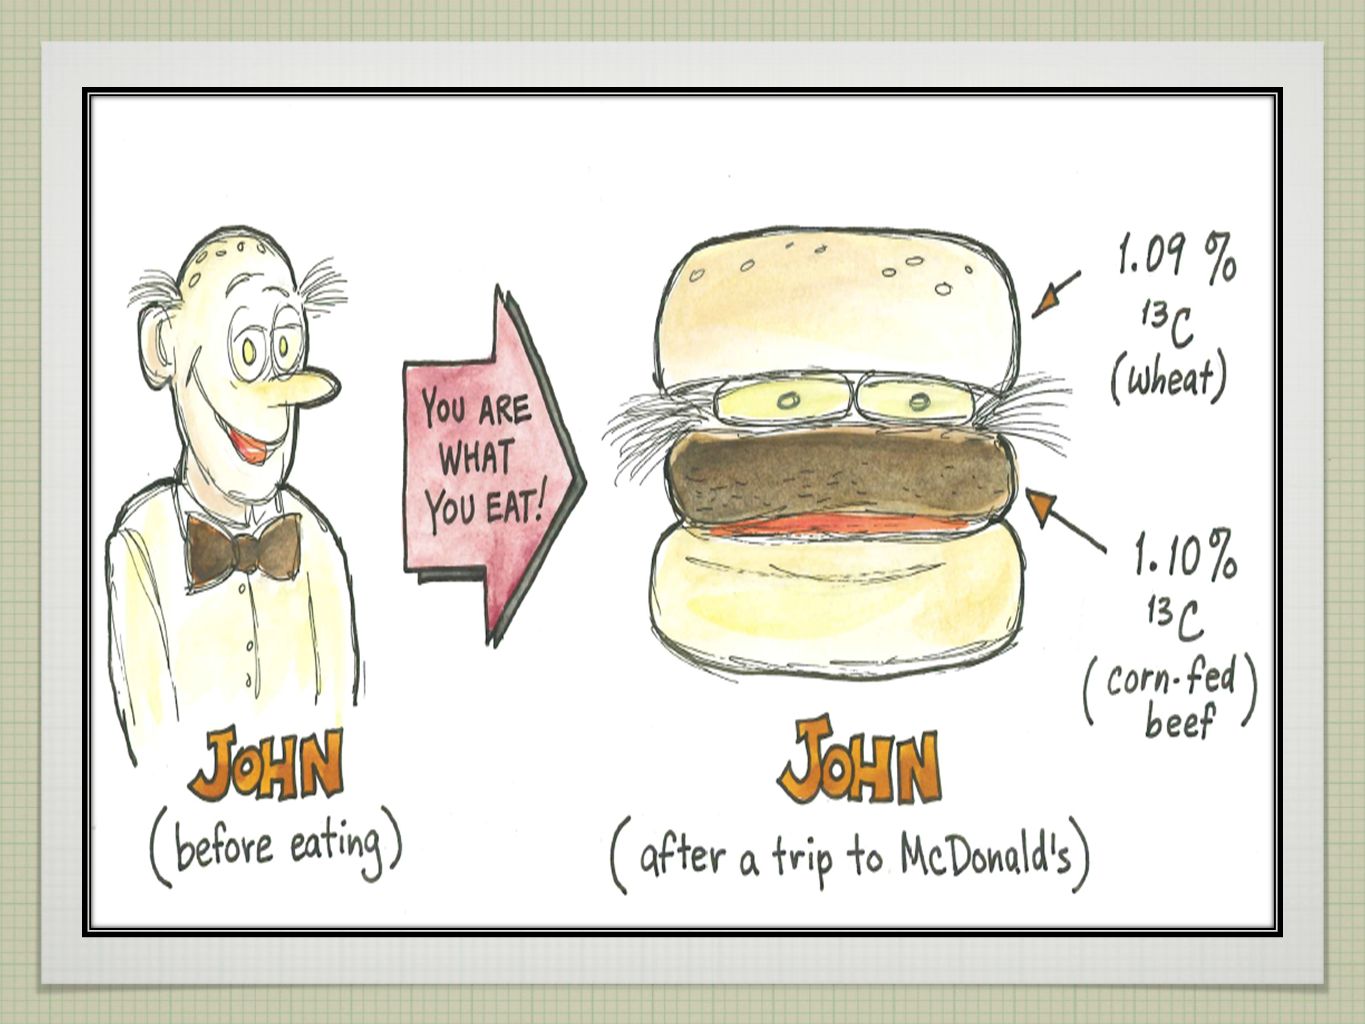
There is one other way to help figure out who eats whom… Why do animals eat? to obtain energy to obtain the basic building blocks for growth such as amino acids which are made of C, N, O, H and other elements. C, N, O, H in food (metabolic processes) C, N, O, H in our own bodies It has to do with the expression You are what you eat!
 C, N, O, H in our own bodies It has to do with the expression You are what you eat!.")
10
What you may not know is that these elements (C, N, O, H, etc…) each have a “chemical signature” inside the body. This signature comes from the proportion of stable isotopes in each element.

11
Isotopes Atoms with the same number of electrons and protons, but different numbers of neutrons, are called isotopes. So, 12 C and 13 C are isotopes of the element Carbon. How are the two Carbon isotopes similar? Different?

12
Which is a LIGHT isotope and which is a HEAVY isotope?? WHY?

13
Not all isotopes are treated equally. In fact, in many processes that require energy, the lighter isotope is preferred.

14
In food webs, more 12 C than 13 C is incorporated into the organism’s tissue.

15
Plants will tend to use the lighter carbon ( 12 C) when they take up CO 2 from the air and this changes the plant’s proportion of isotopes. And, different plants use isotopes differently: Corn and sugar cane tend to use more 13 C Wheat and other grasses tend to use less 13 C So, wheat’s 13 C proportion is lower than corn’s.

16
Since the difference in these proportions is so small, scientists convert the proportion to a whole number to magnify the difference. In Corn, 13 C % converts to C = -12 In Wheat, 13 C % converts to 13 C = - 25

17
Here’s the conversion. C = () 11000 13 C 12 C sample 13 C 12 C standard In the conversion, we relate the sample to a standard to standardize the comparison. Don’t worry about the math!
 C 12 C sample 13 C 12 C standard In the conversion, we relate the sample to a standard to standardize the comparison. Don’t worry about the math!.")
18
1.11% 13 C in Air converts to C = -7. In Corn, 1.10% 13 C converts to C = -12 And in Wheat, 1.09% 13 C converts to 13 C = - 25. In other words... The lower the proportion 13 C, the more negative the 13 C

19
Let’s look at some real data, from cows! C Why are the carbon isotope values from these two cattle populations different? Hint: think about what cows eat. Here are C values from cows from Britain and Brazil

20
Carbon Isotope Analysis C The cows from Brazil are fed primarily a corn diet. Corn has higher C values of -15 to -10. The cows from Britain graze on grass and fodder, similar to wheat. Grasses have lower C values between -30 to -22. C values from cows from Britain and Brazil Corn-fedGrass-fed

21
Carbon isotopes can tell us about the primary producer in the food chain! C C values from cows from Britain and Brazil Corn-fedGrass-fed Primary Producer Primary Consumer Corn (-12)Cows in Brazil Grass (-25) Cows in Britain
Cows in Brazil Grass (-25) Cows in Britain.")
22
What about secondary consumers? Hence the term “You are what you eat!” Or rather, “You are what your primary producer produced.” With each link in the food web, C hardly changes. If a Jaguar in Brazil were to prey on cows there, its C value would be similar to the cows and corn ~ -13. If a Jaguar fed on cows in Britain, its C value would be ~ -25, like the cows there and what they ate grass. Primary Primary Secondary Producer Consumer Consumer Corn (-13) Cows in BrazilJaguar (-13) Grass (-25) Cows in BritainJaguar (-25)
 Cows in BrazilJaguar (-13) Grass (-25) Cows in BritainJaguar (-25).")
23
Carbon isotopes can tell us about the primary producer in an ocean food chain! In an ocean food chain, C is between -10 and -35 when the primary producer uses photosynthesis to fix Carbon. Primary Primary Secondary Producers Consumers Consumers Algae CoralCrab Phytoplankton ZooplanktonFish

25
But wait! Other isotopes can tell us more things about food webs. Stable Nitrogen isotopes indicate trophic relationships (i.e., primary producer, primary consumer, secondary consumer, top predator).
..")
26
Consider the Nitrogen isotope values from a hair analysis of 16 individuals Eight of the individuals were strictly vegetarians (primary consumers) The other eight individuals ate meat (secondary consumers). Nitrogen N) Notice, the meat-eaters’ 15 N values are higher than the vegans, and the meat-eaters’ trophic level is higher too. People
 Notice, the meat-eaters’ 15 N values are higher than the vegans, and the meat-eaters’ trophic level is higher too. People.")
27
Nitrogen Isotopes & Trophic Level N can be used to indicate trophic level such as 1°producer, 1°consumer, 2°consumer, or top predator. Nitrogen N) The general rule for N is “You are what you eat +3” People
 The general rule for N is You are what you eat +3 People.")
28
Ok, let’s look at the Lophelia community again and try to figure out the food web. Crab: Munidopsis spp. Coral: Lophelia pertusa Hydroids Consider the following three species…

29
Lophelia Community Isotope Data Hydroids Lophelia Munidopsis (NOTE: C isotope values on the X-axis & N isotope values on the Y-axis.)
")
30
The C value for all three species is in the range of photo- synthetic primary production. This means that these seafloor animals are getting their food from ocean surface processes. C Values Munidopsis: ~ -22 to -13 Hydroids: ~ - 23 to -17 Lophelia: ~ - 23 to -24 Hydroids Lophelia Munidopsis

31
The N values for all hydroids are very similar indicating they are feeding at the same trophic level (e.g., they are all eating particulate organic matter or “POM”). N Values Hydroids: ~ 8 to 9 Hydroids Lophelia Munidopsis

32
The N value for Munidopsis, on the other hand, is higher than for Hydroids, indicating that crabs are feeding at a higher trophic level. N Values Munidopsis: ~ 10 to 14 Hydroids Lophelia Munidopsis

33
The N values for Lophelia are at two different levels indicating that it too feeds at different trophic levels (i.e., some polyps may have eaten “POM” and other polyps may have eaten small copepods that ate “POM”). N Values Lophelia: ~ 8 to 13 Hydroids Lophelia Munidopsis

34
Lophelia Fish Sponge Crab Hydroid s Soft Coral with Brittle Star Given all the tools you have learned about, see what you can do to put these organisms into a food web.

35
Starting with trophic levels, let’s see what we know. Lophelia Fish Crab Hydroids Soft Coral with Brittle Star Mixed trophic level consumers 1 consumers ° 2 consumers ° Sponge

36
By sorting out trophic levels and determining that the source of the food web originates in surfaces waters where sunlight reaches, we have come a long way in understanding the Lophelia community food web. And there is still much left to study and sort out!

37
Technically speaking, the C of a primary producer depends on: carbon input (e.g., source of inorganic carbon like CO 2 or hydrocarbons) the pathway the organism uses to fix carbon. What this means is that C values can indicate the source of primary production in a food web. When carbon is fixed by photosynthesis, C can range from - 35 to -10. Grass Corn Chemosynthetic microbes When carbon is fixed by chemosynthesis, C can range from - 60 to -20.

Similar presentations