Download presentation
Presentation is loading. Please wait.

1
Gina Rico Méndez, PhD Candidate Fulbright Scholar Mississippi State University gina.mendez@ssrc.msstate.edu Prepared for the Annual World Bank Conference on Land and Poverty: Scaling up Responsible Land Governance Washington D.C. March 14 -18, 2016 Does land distribution affect poverty in Latin America? A cross-sectional analysis of Colombian Municipalities (*) (*) Work in Progress. Please do not cite or quote without the permission of corresponding author
 (*) Work in Progress. Please do not cite or quote without the permission of corresponding author.")
2
Copyright 2016 by author(s). All rights reserved. Readers may make verbatim copies of this document for non-commercial purposes by any means, provided that this copyright notice appears on all such copies.

3
Table of Contents 1.Context 2.Theoretical Underpinnings 3.Methods & Data 4.Findings 5.Discussion

4
Population, total: 48,570,610 (DANE, 2016) Poverty headcount ratio at national poverty lines: 28.5% (World Bank, 2014) Human Development Index: Ranked 97 – High Human Development (UNDP, 2014) Government: Unitary republic Three branches of Political Power – The President is the chief of state and head of government Multi-party system - 8 mayor political parties 32 Departments (Administrative Division) Google.com/maps Republic of Colombia
 Poverty headcount ratio at national poverty lines: 28.5% (World Bank, 2014) Human Development Index: Ranked 97 – High Human Development (UNDP, 2014) Government: Unitary republic Three branches of Political Power – The President is the chief of state and head of government Multi-party system - 8 mayor political parties 32 Departments (Administrative Division) Google.com/maps Republic of Colombia")
5
Upper middle income country - GDP per capita $12,743 (WB, 2014) 76 % of urban population (WB, 2014). 85 % of urban population with access to sanitation facilities (WB, 2015). Gini index: 55.91 % (WB, 2010) Strong democratic tradition – Uninterrupted elections in recent history Context
. Gini index: % (WB, 2010) Strong democratic tradition – Uninterrupted elections in recent history Context.")
6
In 2014 44.7% of rural population lived in conditions of poverty (DANE, 2015) Deficient rural infrastructure & small farming lacks access to technology (DANE, 2015) More than 50 years of armed conflict. Has taken place in rural areas mostly. Rural land Gini index: 88% (IGAC, 2012)
.")
7
NATIONAL RURAL LAND GINI. 2000-2009 Catastro Jurisdicción IGAC. Land Gini (GINI tierras) Property Value Gini (GINI avaluo) 20000.8540.806 20010.8560.806 20020.8550.807 20030.8550.811 20040.8560.809 20050.8550.809 20060.8550.814 20070.8560.817 20080.8600.820 20090.8590.845 Rural Land Gini, 2000-2009 Fuente: Atlas de la distribución de la Propiedad Rural en Colombia. CEDE) UNIANDES)-IGAC-Universidad de Antioquia.
 Property Value Gini (GINI avaluo) Rural Land Gini, Fuente: Atlas de la distribución de la Propiedad Rural en Colombia. CEDE) UNIANDES)-IGAC-Universidad de Antioquia..")
8
State Building Aggregation of Policy Preferences Legitimacy Strategies for poverty Reduction: The role of public investment Problem Solving Does land distribution affect attempts of reducing poverty in rural areas? Theoretical Underpinnings Policy Formation and Implementation: Land & poverty ???

9
Solving Collective Action Problems (POVERTY) Solving Collective Action Problems (POVERTY) STATE BUILDING THEORIES (Explore the conditions for states to obtain & maintain legitimacy) STATE BUILDING THEORIES (Explore the conditions for states to obtain & maintain legitimacy) MECHANISMS TO AGGREGATE POLICY PREFERENCES (They are concerned with the most effective means to solve collective action problems) MECHANISMS TO AGGREGATE POLICY PREFERENCES (They are concerned with the most effective means to solve collective action problems) Theoretical Underpinnings
 Solving Collective Action Problems (POVERTY) STATE BUILDING THEORIES (Explore the conditions for states to obtain & maintain legitimacy) STATE BUILDING THEORIES (Explore the conditions for states to obtain & maintain legitimacy) MECHANISMS TO AGGREGATE POLICY PREFERENCES (They are concerned with the most effective means to solve collective action problems) MECHANISMS TO AGGREGATE POLICY PREFERENCES (They are concerned with the most effective means to solve collective action problems) Theoretical Underpinnings")
10
State- Building Theories Modernization theories Dependency theories Political Economy Equilibria http://www.planetacolombia.com/gobierno-de-colombia-F1008C80618D7 https://sites.google.com/site/columbiamhall/Gobierno-Colombiano

11
Theoretical Underpinnings Preference Aggregation Theories Government Markets Democracy https://nznoblog.org.nz/2014/03/

12
Theoretical Underpinnings The role of public investment in poverty alleviation New Institutional Economics (D.C. North, 1990; Douglass C. North & Weingast, 1989; Olson, 1993). Institutions matter because they set the rules of the game, reducing uncertainty and transaction costs. Human development (Sen, 1992, 2000; Stiglitz, 2012). Importance of equity in the distribution of social goods. Basic Development of human capacities as the basis of freedom
. Institutions matter because they set the rules of the game, reducing uncertainty and transaction costs. Human development (Sen, 1992, 2000; Stiglitz, 2012). Importance of equity in the distribution of social goods. Basic Development of human capacities as the basis of freedom.")
13
Theoretical Underpinnings The role of land distribution in poverty Land reform & secure property rights are likely to promote economic growth in developing countries. (Barlowe, 1953; Besley & Burgess, 2000; Deininger, Jin, & Nagarajan, 2009) Land reform but also rural development policies are seen as necessary to promote economic growth in rural areas. (Machado, 1991, 1999) Land reform as counterinsurgency strategy. (Albertus & Kaplan, 2013) In countries like Colombia inequality in land distribution and lack of a fair structure of property rights seems to affect poverty alleviation strategies. (Kalmanovitz, 2000, Machado 1999)
 Land reform but also rural development policies are seen as necessary to promote economic growth in rural areas. (Machado, 1991, 1999) Land reform as counterinsurgency strategy. (Albertus & Kaplan, 2013) In countries like Colombia inequality in land distribution and lack of a fair structure of property rights seems to affect poverty alleviation strategies. (Kalmanovitz, 2000, Machado 1999).")
14
Research Question & Purpose of the Study Does land distribution affect poverty in Colombia? Thus, is concentration of land a central factor preventing alleviation of rural poverty in Colombia? The purpose of this study is to explore the role of land distribution in small-size Colombian municipalities, controlling for institutional factors such as public investment, agricultural production and political participation.

15
METHODS AND DATA

16
CategoryPopulationCurrent Revenue - MMW* EspecialEqual or above 500,000Above 400,000 MMV First Between 100,001 and 500,000 Above 100,000 MMW and until 400,000 MMV Second Between 50,001 and 100,000 Above 50,000 MMW and until 100,000 MMV Third Between 30,001 and 50,000 Above30,000 MMW and until 50,000 MMV Fourth Between 20,001 and 30,000 Above25,000 MMW and until 30,000 MMV Fifth Between 10,001 and 20,000 Above 15,000 MMW and until 25,000 MMV SixthEqual or under 10,000Less than 15,000 MMW Unit of Analysis: Small Municipalities (N= 408) * Monthly Minimum Wages. Minimum wage 2008 $461,500.00 (Colombian pesos) Source: DAFP, 2007 City/Municipal Categorization - Law 617/2000
 Source: DAFP, 2007 City/Municipal Categorization - Law 617/2000.")
17
Variables (DV)
")
18
Variables (IV)
")
19
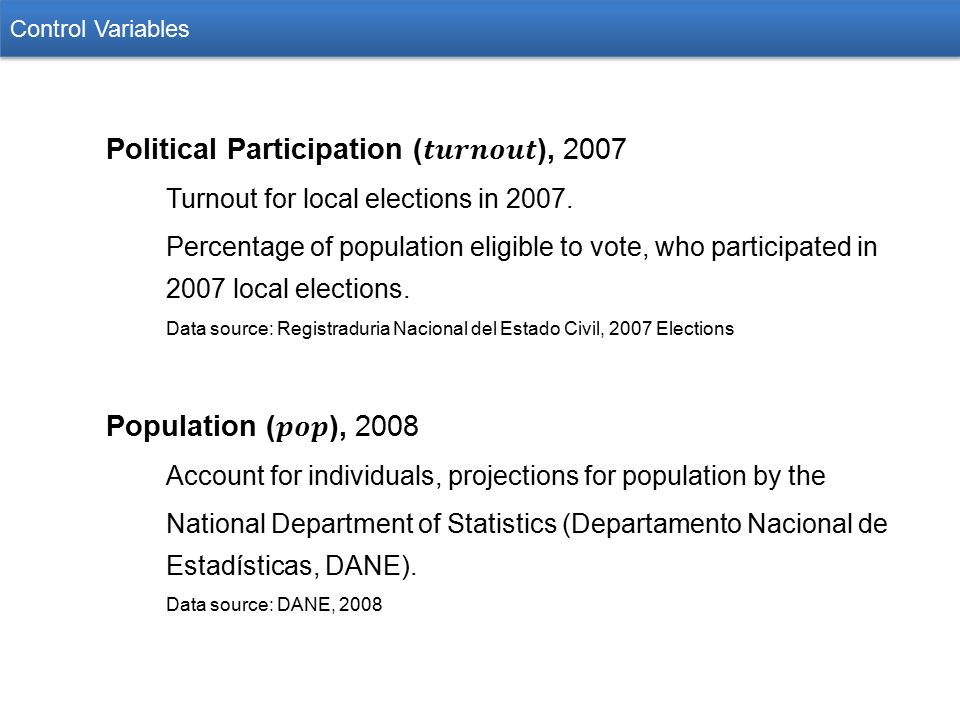
Control Variables

21
Agricultural featured product Variable NameDepartment(s) (*) Corn, cassava and plantain ag1_corn_cas_plant Amazonas, Arauca, Atlántico, Bolívar, Caquetá, Chocó, Guainía, Guaviare, La Guajira, Putumayo, Quindío, Vaupés, Vichada Rice ag2_rice Casanare, Huila, Sucre, Tolima Coffee ag3_coffee Caldas, Norte de Santander, Risaralda Sugar cane ag4_sugarcane Cauca, Valle del Cauca Palm oil ag5_palm Cesar, Meta, Santander Export Banana and Plantain ag6_exp_ban_plant Antioquia, Magdalena Potato ag7_pot Boyacá, Cundinamarca, Nariño Note (*) This paper contains information for 30 departments only. San Andr é s and C ó rdoba do not have sixth category municipalities. Source: Author based on analysis of agricultural data per department using information retrieved from Ministry of Agriculture and Rural Development of Colombia (http://www.agronet.gov.co/Paginas/estadisticas.aspx)http://www.agronet.gov.co/Paginas/estadisticas.aspx Featured Agricultural Product by Department

22
Statistical model

23
(1)(2)(3)(4)(5) VARIABLESNmeansdminmax ubn 40843.2415.5914.51100 lgini 4080.6790.09790.3600.980 capinvestpcap 408665,398419,807261,0424.954e+06 royrec 4080.3580.48001 pop 4085,8812,3729579,987 turnout 40869.158.76529.5991.97 ag1_corn_cas_plant 4080.08580.28001 ag2_rice 4080.1050.30701 ag3_coffee 4080.06860.25301 ag4_sugarcane 4080.02450.15501 ag5_palm 4080.1760.38201 ag6_exp_ban_plant 4080.1150.32001 ag7_pot 4080.4240.49501 Descriptive Statistics (*) Obtained using Stata 13
(2)(3)(4)(5) VARIABLESNmeansdminmax ubn lgini capinvestpcap ,398419,807261, e+06 royrec pop 4085,8812, ,987 turnout ag1_corn_cas_plant ag2_rice ag3_coffee ag4_sugarcane ag5_palm ag6_exp_ban_plant ag7_pot Descriptive Statistics (*) Obtained using Stata 13")
24
H1. Municipalities with higher land Gini coefficient are more likely to have larger percentage of UBN population H2. Municipalities with higher per capita capital investment are more likely to have higher percentage of UBN population. H3. Municipalities that receive royalties are more likely to have larger percentage of UBN population. H4. Municipalities with larger levels of political participation are more likely to have lower percentage of UBN population. H5. Municipalities with larger population size are more likely to have higher percentage of UBN population Hypotheses

25
(1)(2)(3)(4)(5)(6)(7)(8) VARIABLES Model 1Model 2Model 3Model 4Model 5Model 6Model 7Model 8 lgini -8.500-8.861-9.651-5.439-8.514-4.287-4.043 (8.490)(8.730)(8.426)(8.588)(8.441)(8.887)(8.846) capinvestpcap 9.18e-06*** 8.79e-06***6.92e-06***9.18e-06***8.77e-06*** 8.80e-06*** (2.23e-06) (1.64e-06)(2.22e-06)(2.16e-06) (2.14e-06) royrec -2.124-0.959 -1.197-2.126-2.178 -2.262 (1.612)(1.640) (1.663)(1.605)(1.672) (1.648) pop 0.00128***0.000722**0.00120*** 0.00128***0.00111*** 0.00109*** (0.000380)(0.000366)(0.000387) (0.000372)(0.000375) (0.000372) turnout -0.002220.0303-0.00821-0.0971 0.0639 0.0585 (0.0908)(0.0916)(0.0902)(0.0895) (0.0991) (0.0977) ag1_corn_cas_plant 5.0275.8125.289 (9.564)(9.708)(9.495) ag2_rice -2.973-0.394-3.072 (9.319)(9.244)(9.417) ag3_coffee -4.254-5.764-4.292 (9.048)(9.163)(9.117) ag5_palm -4.441-4.960-4.426 (9.046)(9.058)(9.099) ag6_exp_ban_plant -1.249-1.235-1.429 (9.202)(9.347)(9.321) ag7_pot -1.829-2.443-1.759 (9.041)(9.016)(9.070) Constant 36.28***43.25***37.43***49.47***36.12***32.00**47.97***29.56*** (8.672)(8.511)(8.616)(8.318)(6.117)(12.51)(11.55)(11.00) Observations 408 R-squared 0.0650.0130.0610.0360.0650.0860.0360.086 (*) Obtained using Stata 13 Result for (ubn). Generalized Linear Models.

26
H6. Municipalities featured by corn, cassava and plantain as agricultural products are more likely to have higher percentage of UBN population Hypotheses pertaining agriculture (1) H7. Municipalities featured by rice as agricultural product are more likely to have lower percentage of UBN population H8. Municipalities featured by coffee as agricultural product are more likely to have lower percentage of UBN population
 H7. Municipalities featured by rice as agricultural product are more likely to have lower percentage of UBN population H8. Municipalities featured by coffee as agricultural product are more likely to have lower percentage of UBN population.")
27
(1)(2)(3)(4)(5)(6)(7)(8) VARIABLES Model 1Model 2Model 3Model 4Model 5Model 6Model 7Model 8 lgini -8.500-8.861-9.651-5.439-8.514-4.287-4.043 (8.490)(8.730)(8.426)(8.588)(8.441)(8.887)(8.846) capinvestpcap 9.18e-06*** 8.79e-06***6.92e-06***9.18e-06***8.77e-06*** 8.80e-06*** (2.23e-06) (1.64e-06)(2.22e-06)(2.16e-06) (2.14e-06) royrec -2.124-0.959 -1.197-2.126-2.178 -2.262 (1.612)(1.640) (1.663)(1.605)(1.672) (1.648) pop 0.00128***0.000722**0.00120*** 0.00128***0.00111*** 0.00109*** (0.000380)(0.000366)(0.000387) (0.000372)(0.000375) (0.000372) turnout -0.002220.0303-0.00821-0.0971 0.0639 0.0585 (0.0908)(0.0916)(0.0902)(0.0895) (0.0991) (0.0977) ag1_corn_cas_plant 5.0275.8125.289 (9.564)(9.708)(9.495) ag2_rice -2.973-0.394-3.072 (9.319)(9.244)(9.417) ag3_coffee -4.254-5.764-4.292 (9.048)(9.163)(9.117) ag5_palm -4.441-4.960-4.426 (9.046)(9.058)(9.099) ag6_exp_ban_plant -1.249-1.235-1.429 (9.202)(9.347)(9.321) ag7_pot -1.829-2.443-1.759 (9.041)(9.016)(9.070) Constant 36.28***43.25***37.43***49.47***36.12***32.00**47.97***29.56*** (8.672)(8.511)(8.616)(8.318)(6.117)(12.51)(11.55)(11.00) Observations 408 R-squared 0.0650.0130.0610.0360.0650.0860.0360.086 (*) Obtained using Stata 13 Result for (ubn). Generalized Linear Models.

28
H10. Municipalities featured by oil palm as agricultural product are more likely to have higher percentage of UBN population H11. Municipalities featured by export banana and plantain as agricultural products are more likely to have higher percentage of UBN population H12. Municipalities featured by potato as agricultural product are more likely to have lower percentage of UBN population Hypotheses pertaining agriculture (2)
.")
29
(1)(2)(3)(4)(5)(6)(7)(8) VARIABLES Model 1Model 2Model 3Model 4Model 5Model 6Model 7Model 8 lgini -8.500-8.861-9.651-5.439-8.514-4.287-4.043 (8.490)(8.730)(8.426)(8.588)(8.441)(8.887)(8.846) capinvestpcap 9.18e-06*** 8.79e-06***6.92e-06***9.18e-06***8.77e-06*** 8.80e-06*** (2.23e-06) (1.64e-06)(2.22e-06)(2.16e-06) (2.14e-06) royrec -2.124-0.959 -1.197-2.126-2.178 -2.262 (1.612)(1.640) (1.663)(1.605)(1.672) (1.648) pop 0.00128***0.000722**0.00120*** 0.00128***0.00111*** 0.00109*** (0.000380)(0.000366)(0.000387) (0.000372)(0.000375) (0.000372) turnout -0.002220.0303-0.00821-0.0971 0.0639 0.0585 (0.0908)(0.0916)(0.0902)(0.0895) (0.0991) (0.0977) ag1_corn_cas_plant 5.0275.8125.289 (9.564)(9.708)(9.495) ag2_rice -2.973-0.394-3.072 (9.319)(9.244)(9.417) ag3_coffee -4.254-5.764-4.292 (9.048)(9.163)(9.117) ag5_palm -4.441-4.960-4.426 (9.046)(9.058)(9.099) ag6_exp_ban_plant -1.249-1.235-1.429 (9.202)(9.347)(9.321) ag7_pot -1.829-2.443-1.759 (9.041)(9.016)(9.070) Constant 36.28***43.25***37.43***49.47***36.12***32.00**47.97***29.56*** (8.672)(8.511)(8.616)(8.318)(6.117)(12.51)(11.55)(11.00) Observations 408 R-squared 0.0650.0130.0610.0360.0650.0860.0360.086 (*) Obtained using Stata 13 Result for (ubn). Generalized Linear Models.

30
Although non-statistically significant, none of the models provide evidence to support the hypothesis municipalities with higher land Gini coefficient are more likely to have a larger percentage of UBN population. Instead the results show a negative correlation between land Gini and poverty. Findings & Discussion

31
The findings of this research suggest that poverty levels tend to be lower in municipalities with higher land inequality. Small population size in areas of industrialized agriculture. Less population can enhance distribution of public goods (Considering public investment as means of reducing poverty). Presence of industrial agriculture may be contributing to reduce poverty in rural areas with small population. Similarly, public capital investment, may not be significantly influential in reducing poverty due to additional stressors such as armed conflict and higher levels of corruption in small municipalities. Findings & Discussion
. Presence of industrial agriculture may be contributing to reduce poverty in rural areas with small population. Similarly, public capital investment, may not be significantly influential in reducing poverty due to additional stressors such as armed conflict and higher levels of corruption in small municipalities. Findings & Discussion.")
32
Further analysis should include additional variables (e.g. investment in large-scale agriculture, rural infrastructure, employment and municipal income) Also it is important to include additional years in the analysis, to include enhance the performance of the statistical model. Findings & Discussion
 Also it is important to include additional years in the analysis, to include enhance the performance of the statistical model. Findings & Discussion.")
33
Thank you! gina.mendez@ssrc.msstate.edu

Similar presentations