Download presentation
Presentation is loading. Please wait.

1
POPULATION DYNAMICS Population: All the individuals of a species that live together in an area Demography: The statistical study of populations, allows predictions to be made about how a population will change

2
POPULATIONS School of fish Herd of antelope Pride of lions Clump of grass Colony of ants Pod of whales Orchard of trees

3
POPULATION DYNAMICS Three Key Features of Populations Size Dispersion Density

4
Population Size Size: number of individuals in an area

5
Patterns of population dispersion

6
CLUMPED DISPERSION

7
UNIFORM DISPERSION

8
RANDOM DISPERSION

9
Density: measurement of population per unit area or unit volume Pop. Density = # of individuals ÷ unit of space Population Density

10
1. Immigration: movement of individuals into a population 2. Emigration: movement of individuals out of a population 3. Density-dependent factors: Biotic factors in the environment that have an increasing effect as population size increases (disease, competition, parasites) 4. Density-independent factors: Abiotic factors in the environment that affect populations regardless of their density (temperature, weather) WHAT AFFECTS DENSITY?
 4. Density-independent factors: Abiotic factors in the environment that affect populations regardless of their density (temperature, weather) WHAT AFFECTS DENSITY .")
11
Population Growth Growth Rate: Birth Rate (natality) - Death Rate (mortality) How many individuals are born vs. how many die Birth rate (b) − death rate (d) = rate of natural increase (r)
 − death rate (d) = rate of natural increase (r).")
13
Immigration Emigration Natality Mortality Population + + - - Factors That Affect Future Population Growth

14
SURVIVORSHIP CURVES (COMPARE LIFESPANS)
")
16
Population density = number of individuals in a given area or volume Count all the individuals in a population Estimate by sampling Mark-Recapture Method HOW ARE POPULATIONS MEASURED?

17
Idealized models describe two kinds of population growth: 1. Exponential Growth 2. Logistic Growth HOW DO POPULATIONS GROW?

18
CARRYING CAPACITY Carrying Capacity (k): The maximum population size that can be supported by the available resources There can only be as many organisms as the environmental resources can support
: The maximum population size that can be supported by the available resources There can only be as many organisms as the environmental resources can support")
19
MEASURED POPULATION GROWTH dN = births - deaths

20
Exponential growth (J-curve) implies unlimited growth, does not account for resource limitations, or population density Logistic growth (S-curve) shows that growth rate slows as population reaches carrying capacity. (determined by resources)
.")
22
What occurred in the mid-20 th century that allowed the population to grow? According to this curve, had the elephant population yet reached carrying capacity?

23
WHAT FACTORS AFFECT POPULATION GROWTH? Density-dependent Resources Territoriality Disease Predation Density-independent Climate Weather What else?

24
Negative feedback limits population growth

25
How does population density affect its own growth rate?

26
What situation in a population creates this scenario?

28
Some populations are affected by regular cycles of boom & bust.

29
R Strategists Short life span Small body size Reproduce quickly Have many young Little parental care Ex: cockroaches, weeds, bacteria REPRODUCTIVE STRATEGIES

30
K Strategists Long life span Large body size Reproduce slowly Have few young Provides parental care Ex: humans, elephants

31
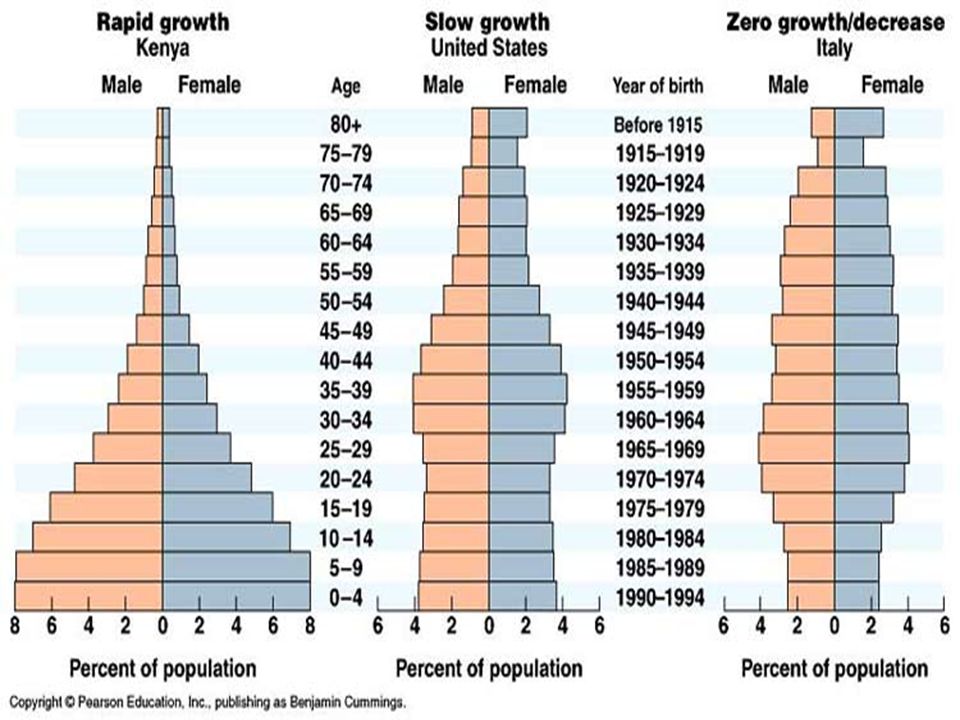
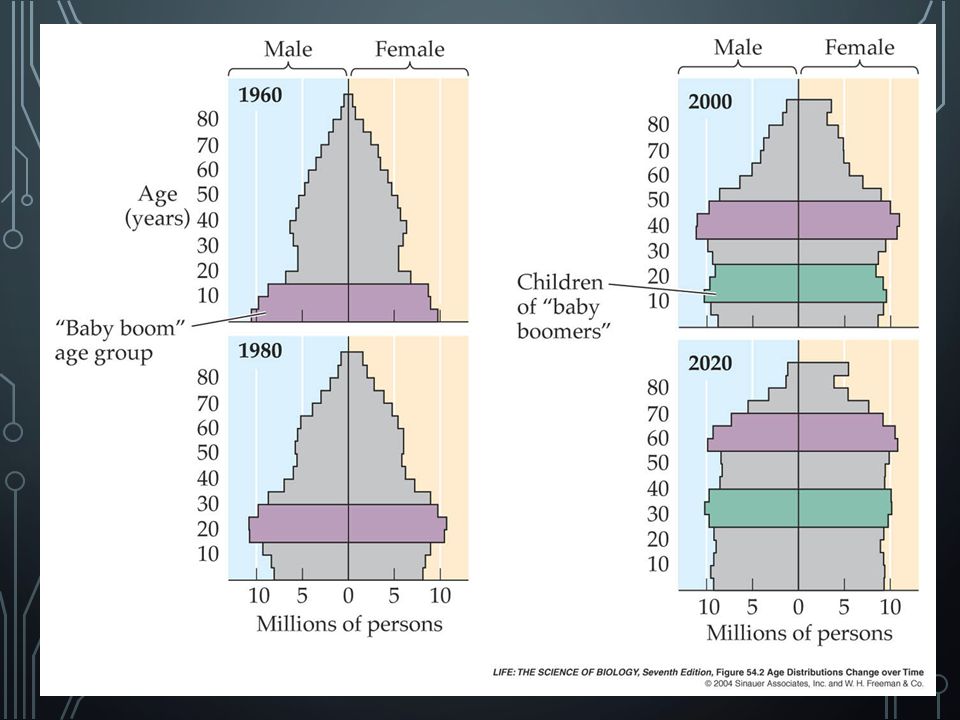
AGE DISTRIBUTION Distribution of males and females in each age group of a population Used to predict future population growth

34
TYPES OF HUMAN SOCIETIES Developing Countries– (pre-industrial) low standard of living, low education, low income, BUT high population (Ethiopia, Nepal, Bangladesh) Transitioning Countries (newly industrialized) Have “graduated” to higher economic rate. (Russia, China, Poland) Developed Countries (post-industrial) highest standard of living and education rates, slow population growth (U.S., Japan, Canada, Germany)
 Developed Countries (post-industrial) highest standard of living and education rates, slow population growth (U.S., Japan, Canada, Germany).")
35
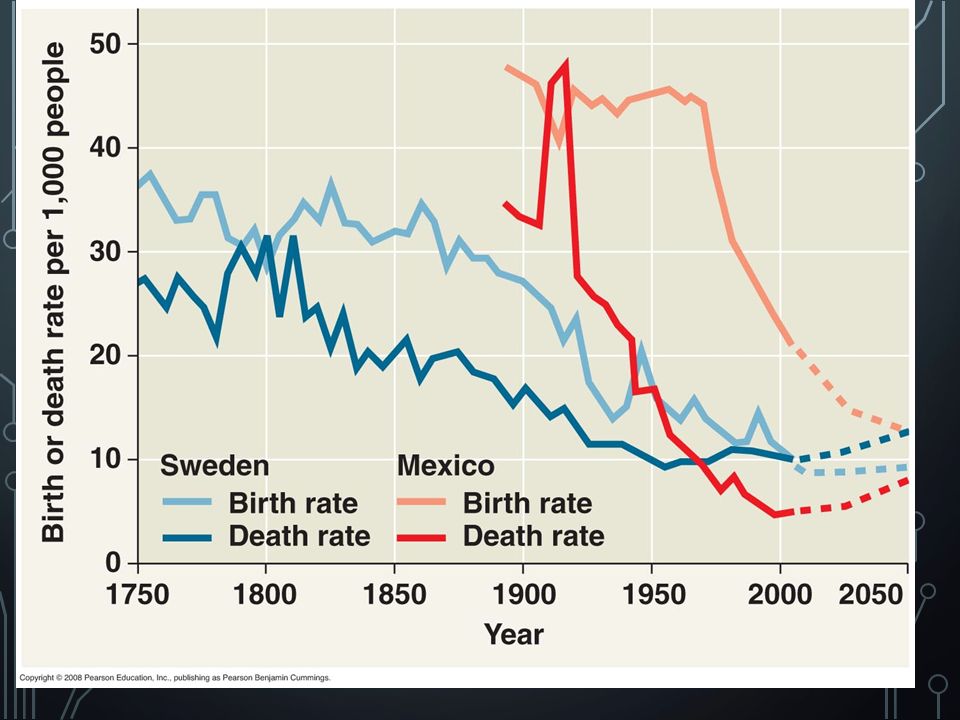
Another factor separating developed from developing—access to health care, which affects life expectancy

36
TOTAL HUMAN POPULATION CHANGES

37
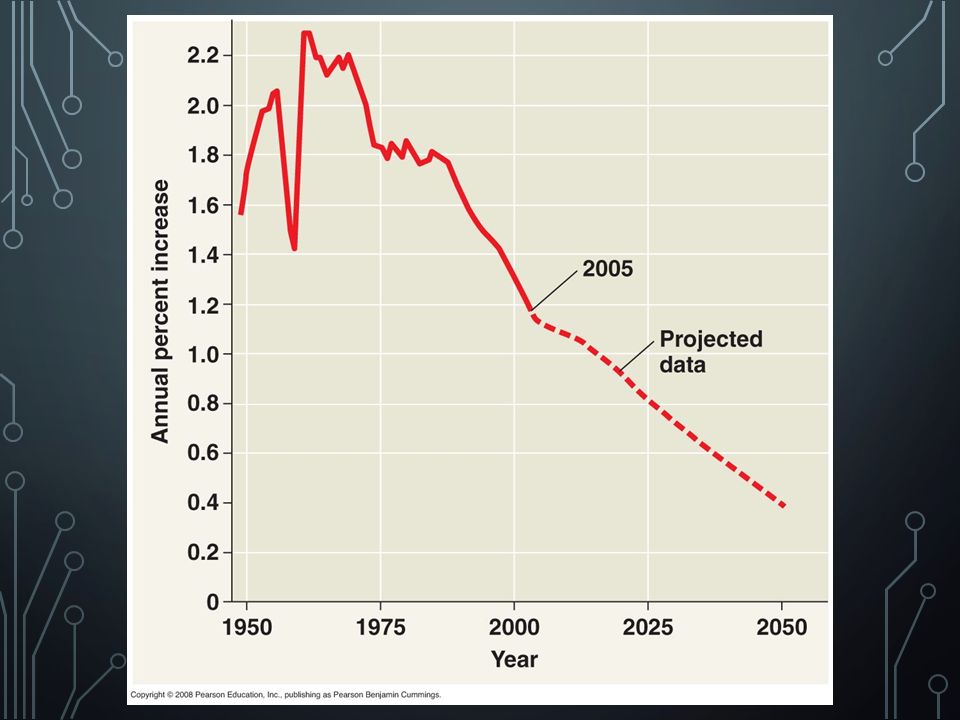
TOTAL HUMAN POPULATION GROWTH J curve growth Grows at a rate of about 80 million yearly r =1.3% Why doesn’t environmental resistance take effect? Altering their environment Technological advances The cultural revolution The agricultural revolution The industrial-medical revolution

38
Doubled three times in the last three centuries About 6.1 billion and may reach 9.3 billion by the year 2050 Improved health and technology have lowered death rates THE ENTIRE HUMAN POPULATION

Similar presentations