Download presentation
Presentation is loading. Please wait.

1
Chapter 4: Measures of Central Tendency

2
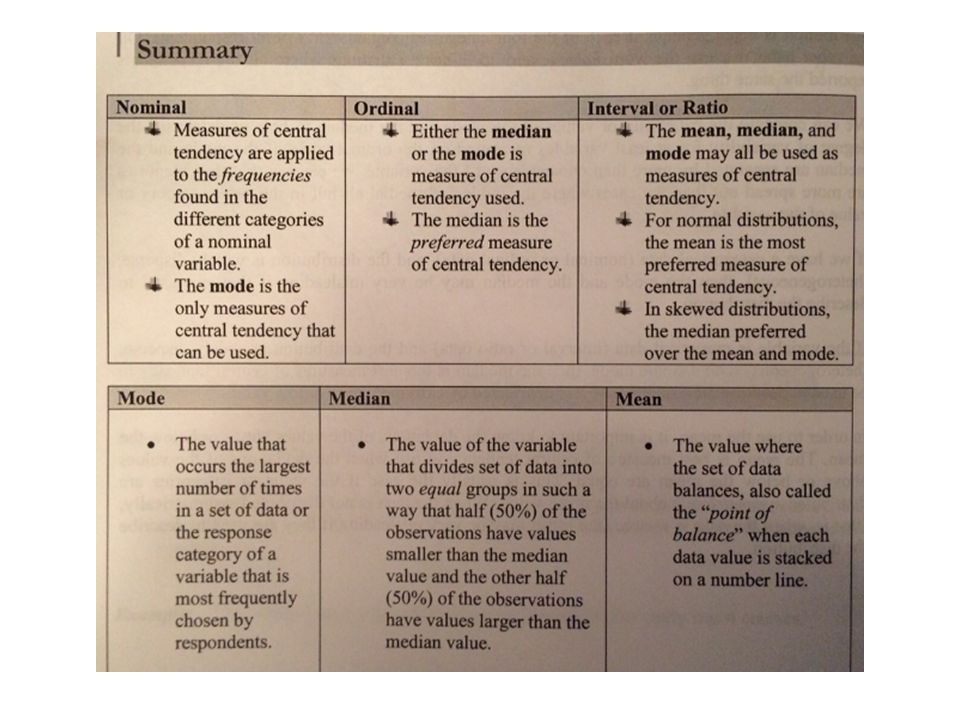
Measures of central tendency are important descriptive measures that summarize a distribution of different categories or values of a variable by reporting the most typical or representative value (a single value) of the distribution. The most common measures of central tendency are the mode, the median, and the mean.

3
Levels of Measurement and Measures of Central Tendency For nominal variables, we can only describe the mode (the value that occurs the most). For ordinal variables, we can describe the mode or the median (the middle value). Median is the preferred measure. For numerical data, the mean is the preferred measure. The mean is the arithmetic average.
. Median is the preferred measure. For numerical data, the mean is the preferred measure. The mean is the arithmetic average..")
4
Uses for Measures of Central Tendency A measure of central tendency can be used as a standard for judging the relative positions of other items in the same set of data (whether a number falls above or below the average and how far away it is from the average. A measure of central tendency can be used to compare the relative sizes of two different sets of data (for example, compare the averages of two sets of data). We get a picture for the variability (spread) of the data by looking at the dispersion (grouping of individual observations around the average). This helps us determine consistency amongst observations.
. We get a picture for the variability (spread) of the data by looking at the dispersion (grouping of individual observations around the average). This helps us determine consistency amongst observations..")
5
The Mode The mode is the value that occurs the largest number of times in a set of data or the response category of a variable that is most frequently chosen by respondents. In a frequency distribution, the mode is the response category that has the largest frequency. In a bar chart or histogram, the mode is the tallest bar.

6
By examining the frequency column, we see the response chosen most often is MARRIED. Therefore, MARRIED is the mode.

7
Fun fact: The mode is the only measure of central tendency that can be used for all levels of measurement (nominal, ordinal, interval, and ratio). When a distribution has one mode, we say it is uni-modal. If it has two modes, we say it is bi- modal. If there are several modes, it is multi- modal.

8
The Median The median is the middle value in a distribution, when the values are arranged according to size. It is the value of the variable that divides a set of data into two equal groups so that half the observations have values smaller than the median, and half have values larger than the median. The median is the preferred measure of central tendency for an ordinal variable.

9
The median is the measure of choice when a numerical variable has some few unusually low or high values in the data set. If this occurs, the mean will be pulled away from the center, and not be representative of the majority of cases. Think about if we were going to calculate the mean salary of students in this classroom. Let’s say Adam Sandler finds out he needs to take Statistics and he transfer into this class. What effect would his salary have on the mean? What type of effect would it have on the median?

10
When a distribution leans to one side or another due to the presence of extreme values, we say the distribution is skewed. A distribution is positively skewed (or skewed right) if there are a greater number of respondents in the lower values and only a few extremely high values. A distribution is negatively skewed (or skewed left) if there are a greater number of respondents in the higher values and only a few extremely low values.
 if there are a greater number of respondents in the lower values and only a few extremely high values. A distribution is negatively skewed (or skewed left) if there are a greater number of respondents in the higher values and only a few extremely low values..")
11
This is a positively skewed (or skewed right) distribution. The mean is pulled down. This is a negatively skewed (or skewed left) distribution. The mean is pushed up.
 distribution. The mean is pushed up..")
12
If a frequency distribution for ordinal data is given, the cumulative percent reports the percent of cases that fall in or below each category or value. The median is the value of the variable below which 50% of the cases lie. The median occurs at the value of the variable where the cumulative percent reaches its first 50% of cases. Reminder: We can’t find the median for nominal data.

13
Up through “once a year” we haven’t yet hit 50% of the data. But once we read “several times a year” the cumulative percent reaches the 50% mark. Therefore, the median is “several times a year.”

14
For numerical data, the median can only be found after the data has been arranged in either ascending or descending order. Example: We ask 7 students how many hot pockets they ate on a Saturday. The results were 4, 2, 1, 5, 9, 6, 4. What’s the median? Say the sample only contained 6 students with the values 1, 2, 3, 4, 6, and 5.

15
Another way to think of the median is as the 50 th percentile. A percentile is a measure that tells us about the percentage of cases in a set of data that falls below a certain value. SAT scores are reported in percentiles. If you scored in the 95 th percentile, it means 95% of all the people who took the SAT had lower scores than you (only 5% of people did better). To find the position of the median of n observations ordered from lowest to highest, use the formula:
. To find the position of the median of n observations ordered from lowest to highest, use the formula:.")
16
Example: What will be the location of the median position if the following given number of observations is arranged in order?

17
Example: Find the median for the following frequency distribution. We need to average the 10 th and 11 th values. Let’s find the cumulative frequency and the positions of the values in the frequency table.

18
The 10 th observation is 35 and the 11 th is 37, so the median is

19
Example: Find the median for the following frequency distribution:

20
The Mean The mean is the arithmetic average of a set of data. It is the point of balance, and is the most widely known measure of central tendency.

21
Notation

22
Example: Find the mean for the following sample.

23
The Mean from a Simple Frequency

24
Example: Find the mean.

25
The Mean from a Grouped Frequency

26
Example: Find the mean.

27
The Relationship Between Mean, Median, and Mode If the values in a distribution are symmetrical about their mean and take the shape of a bell- curve, the distribution is called a Normal distribution and the graph is a Normal curve.

Similar presentations