Download presentation
Presentation is loading. Please wait.

1
Introduction to Biostatistics Lecture 1

2
Biostatistics Definition: – The application of statistics to biological sciences Is the science which deals with the development and application of the most appropriate methods for the: – Collection of data. – Presentation of the collected data. – Analysis and interpretation of the results. – Making decisions on the basis of such analysis 2

3
Why Study Biostatistics? Biostatistics is essential for: Medical (social) research Understanding medical literature Differentiating between facts and fancy in daily life 3
 research Understanding medical literature Differentiating between facts and fancy in daily life 3.")
4
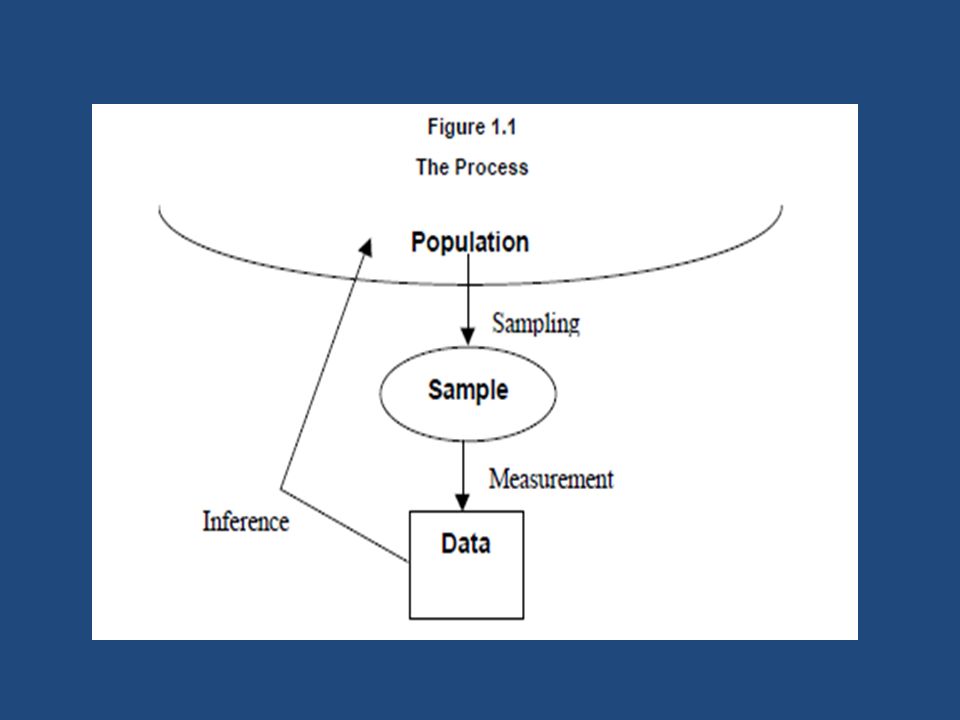
Definitions Population: A set of measurements of interest to the researcher Example: Sample: A subset of the population is called sample. A sample usually selected to be representative to the population 4

6
Population vs Sample The population includes all objects of interest whereas the sample is only a portion of the population. There are several reasons why we don't work with populations; They are usually large, and it is often impossible to get data for every object we're studying. 6

7
Definitions 2 Descriptive statistics deal with the enumeration, organization, and graphical representation of data. Number and % of sample How many are men, women, their age groups … etc. Inferential statistics are concerned with reading conclusions from incomplete information (SAMPLE). – Make inference about the population from a sample Estimation (% of DM among Jordanians) Testing Hypothesis ( is drug A more effective in reducing blood pressure than drug B). 7
. – Make inference about the population from a sample Estimation (% of DM among Jordanians) Testing Hypothesis ( is drug A more effective in reducing blood pressure than drug B). 7.")
8
Qualitative and Quantitative and Variables Example of Qualitative variables: Occupation: Student MD Engineer Example of Quantitative variables: Weight Height Age 8

9
Qualitative and Quantitative and Variables 2 Quantitative variables are variables measured on a numeric scale. Qualitative variables are variables with No natural sense of ordering, Measured on a nominal scale, Qualitative variables can be coded to appear numeric but their numbers are meaningless, as in male=1, female=2 Example: hair color (Black, Brown, Gray, Red, Yellow) is a qualitative variable, 9
 is a qualitative variable, 9.")
10
Variable Types Categorical Variables (qualitative): Sex, Marital Status, income category Continuous Variables (quantitative) : Age, Income, Weight, Height, time Discrete Variables (quantitative) : Number of Students, Number of Children in the House Binary or Dichotomous Variables: yes or no type questions. Do you have kids? Yes, No 10

11
Discrete vs Continuous Discrete variables are usually obtained by counting. There are a finite or countable number of choices available with discrete data. You can't have 2.63 people in the room. Continuous variables are usually obtained by measuring: Length, weight, and time. 11

12
Variables: review Qualitative Variables: Variables which assume non-numerical values. Quantitative Variables: Variables which assume numerical values. Discrete Variables: Variables which assume a finite or countable number of possible values. Usually obtained by counting. Continuous Variables: Variables which assume an infinite number of possible values. Usually obtained by measurement. 12

13
Scale Nominal Scale Ordinal Scale Interval Scale Interval Ratio Scale 13

14
Scales Nominal Scale: Data does not represent an amount or quantity (Sex, Marital Status) Ordinal Scale: Data has an order (Level of Education) Interval Scale: Data is measured on an interval scale having equal units but an arbitrary zero (Temperature in Fahrenheit) 14
 Ordinal Scale: Data has an order (Level of Education) Interval Scale: Data is measured on an interval scale having equal units but an arbitrary zero (Temperature in Fahrenheit) 14")
15
Scales (2) There are four levels of measurement: Nominal, Ordinal, Interval, and Ratio. These go from lowest level to highest level. Each additional level adds something the previous level didn't have. Nominal is the lowest level. Only names are meaningful here. Ordinal adds an order to the names. Interval adds meaningful differences Ratio adds a zero so that ratios are meaningful 15

16
Methods of Data Presentation 1- Numerical presentation 2- Graphical presentation 3- Mathematical presentation 16

17
Organizing Data Frequency Data Frequency Histogram Relative Frequency Histogram Frequency Polygon Bar Chart Pie Chart 17

18
1- Numerical Presentation Name of variable (Units of variable) Frequency (number) % - - Categories - Total Total Tabular presentation (simple – complex) Simple frequency distribution Table 18
 Frequency (number) % - - Categories - Total Total Tabular presentation (simple – complex) Simple frequency distribution Table 18")
19
Table (1): Distribution of patients by blood type Blood group Frequency% ABABO121851524%36%10%30% Total50100 19
: Distribution of patients by blood type Blood group Frequency% ABABO %36%10%30% Total")
20
Table (II): Distribution of patients by age groups Age Group (years)Frequency% 20-3030-4040-5050+121851524361030 Total50100 20
: Distribution of patients by age groups Age Group (years)Frequency% Total")
21
Complex frequency distribution Table Table (III): Distribution of lung cancer patients by smoking status Smoking Lung cancer Total YesNo No.% % % Smoker 1575%820%2338.33 Non smoker 525%3280%3761.67 Total20100%40100%60100% 21
: Distribution of lung cancer patients by smoking status Smoking Lung cancer Total YesNo No.% % % Smoker 1575%820% Non smoker 525%3280% Total20100%40100%60100% 21")
22
22

23
Let’s look at a study question: Is eating breakfast good for you? Does skipping breakfast increase weight gain? PH311/ Fall 201023

24
Betts et al, The causal role of breakfast in energy balance and health: a randomized controlled trial in lean adults, Am J Clin Nutr August 2014 vol. 100 no. 2 539-547 PH311/ Fall 201024

25
Popular beliefs that breakfast is the most important meal of the day are grounded in cross-sectional observations that link breakfast to health, the causal nature of which remains to be explored under real- life conditions. Objective: The aim was to conduct a randomized controlled trial examining causal links between breakfast habits and all components of energy balance in free-living humans. PH311/ Fall 201025

26
PH311/ Fall 201026 TABLE 1 Baseline demographic and anthropometric characteristics and changes at follow-up 1 1

Similar presentations