Download presentation
Presentation is loading. Please wait.

1
Descriptive measures of the degree of linear association R-squared and correlation

4
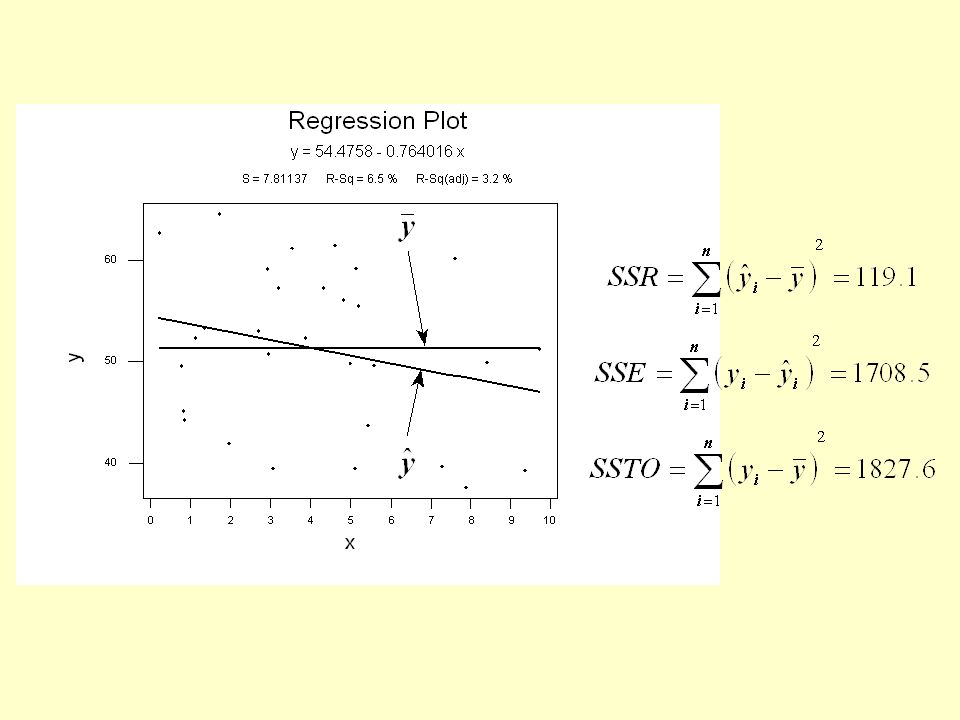
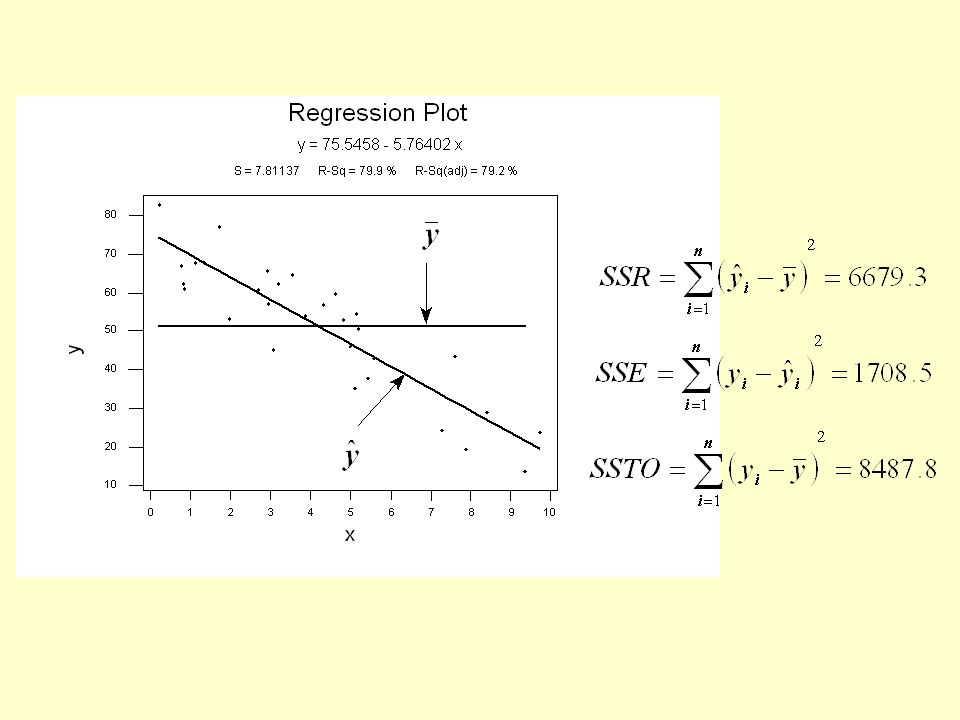
Coefficient of determination R 2 is a number (a proportion!) between 0 and 1. If R 2 = 1: –all data points fall perfectly on the regression line –predictor X accounts for all of the variation in Y If R 2 = 0: –the fitted regression line is perfectly horizontal –predictor X accounts for none of the variation in Y

5
Interpretations of R 2 R 2 ×100 percent of the variation in Y is reduced by taking into account predictor X. R 2 ×100 percent of the variation in Y is “explained by” the variation in predictor X.

6
R-sq on Minitab fitted line plot

7
R-sq on Minitab regression output The regression equation is Mort = 389.189 - 5.97764 Lat S = 19.1150 R-Sq = 68.0 % R-Sq(adj) = 67.3 % Analysis of Variance Source DF SS MS F P Regression 1 36464.2 36464.2 99.7968 0.000 Error 47 17173.1 365.4 Total 48 53637.3
 = 67.3 % Analysis of Variance Source DF SS MS F P Regression Error Total")
8
Correlation coefficient r is a number between -1 and 1, inclusive. Sign of coefficient of correlation –plus sign if slope of fitted regression line is positive –negative sign if slope of fitted regression line is negative.

9
Correlation coefficient formulas

10
Interpretation of correlation coefficient No clear-cut operational interpretation as for R-squared value. r = -1 is perfect negative linear relationship. r = 1 is perfect positive linear relationship. r = 0 is no linear relationship.

11
R 2 = 100% and r = +1

12
R 2 = 2.9% and r = 0.17

13
R 2 = 70.1% and r = - 0.84 U.S. Norway Finland Italy France

14
R 2 = 82.8% and r = 0.91

15
R 2 = 50.4% and r = 0.71

16
R 2 = 0% and r = 0

17
Cautions about R 2 and r Summary measures of linear association. Possible to get R 2 = 0 with a perfect curvilinear relationship. Large R 2 does not necessarily imply that estimated regression line fits the data well. Both measures can be greatly affected by one (outlying) data point.
 data point..")
18
Cautions about R 2 and r A “statistically significant R 2 ” does not imply that slope is meaningfully different from 0. A large R 2 does not necessarily mean that useful predictions can be made. Can still get wide intervals.

Similar presentations


 correlation coefficient r.>")
