Download presentation
Presentation is loading. Please wait.

1
Religious trends in Switzerland: disentangling age, cohort, individual flux and period effects Marion Burkimsher Affiliated to University of Lausanne

2
Outline Data Cohort - age - period trends Individual flux Further research and conclusion

3
Outline Data Cohort - age - period trends Individual flux Further research and conclusion

4
1 Never 2 Only family ceremonies 3 Only religious celebrations 4 Religious celebrations & family events 5 Few times/year 6 About once/month 7 Every 2 weeks 8 Once a week 9 Several times a week 1 Never 2 Occasional 3 Regular Recoding religious attendance (…any religion)
")
5
1Never 2 Few times a year 3Once a month 4>once a week 5 Daily/almost daily 1 Never 2 Occasional 3 Frequent Recoding prayer frequency

6
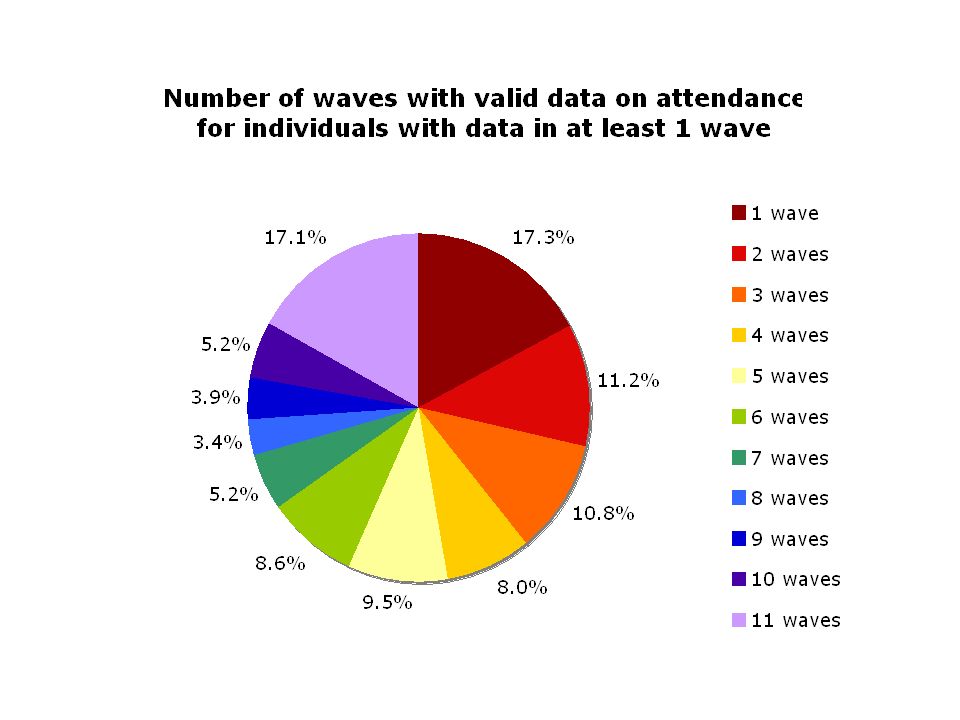
Data issues Data from 11 waves 1999 - 2009, but not 2010 & 2011 Many ‘missings’ - children not included, waves missing, individual dropouts (11,300 total sampled min. once) Additional respondents added in 2004 - but no apparent discontinuity in trends - reassuring that pre-2004 sample had not become less representative over time Similar proportions in religious attenders found in European Social Survey (ESS) - reassuring!
 Additional respondents added in but no apparent discontinuity in trends - reassuring that pre-2004 sample had not become less representative over time Similar proportions in religious attenders found in European Social Survey (ESS) - reassuring!.")
8
Outline Data Cohort - age - period trends Individual flux Further research and conclusion

9
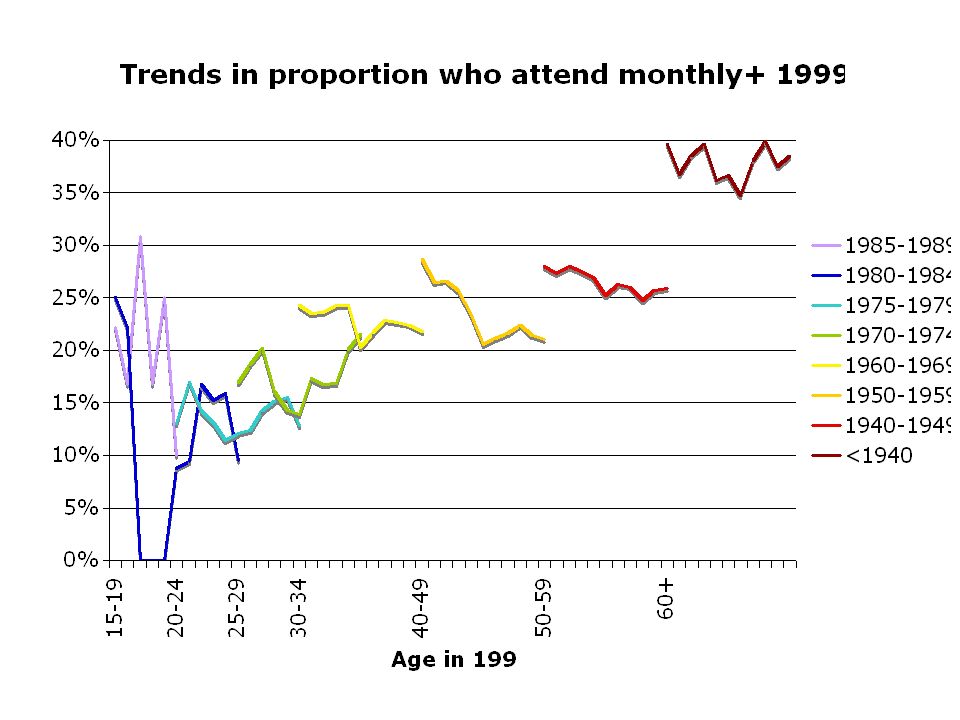
Indications of secularisation Increase in % saying “no religion” from 11% to 16% 1999-2009 Overall decline in regular attenders from 27% to 22% Increase in proportion who never pray from 28% to 33%

13
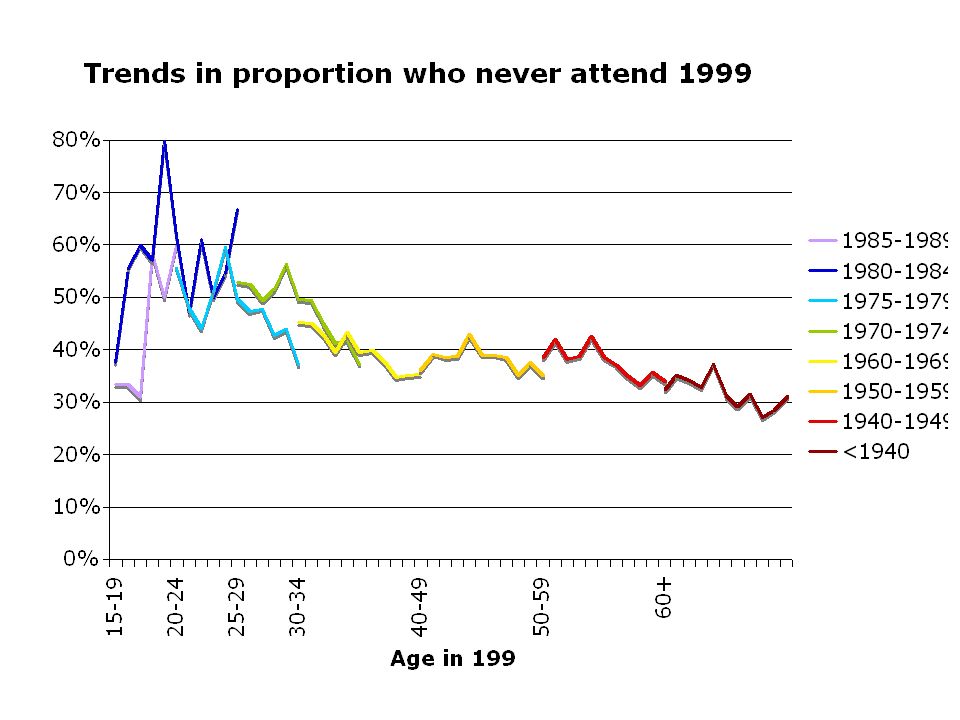
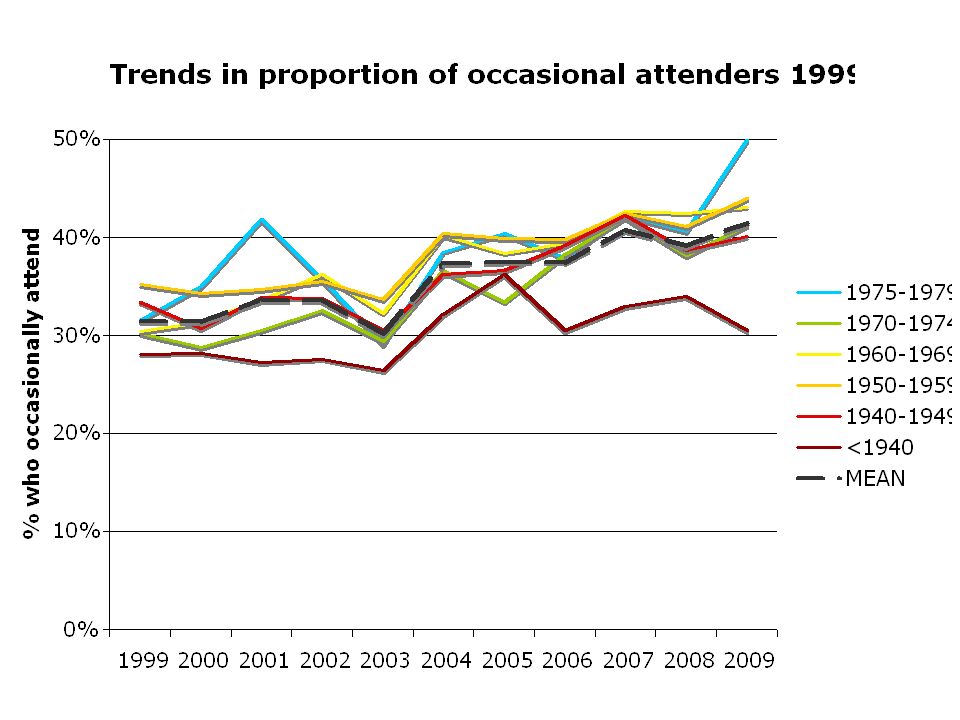
Summary of cohort-age-period attendance graphs Young adult trough in attendance - but small sample numbers give ‘noisy’ data Decline in within-cohort attendance rates -> period secularisation? Cross-cohort differentials (esp. inter-generational non-replacement Decline in those who never attend -> age effect? Increase in proportion who occasionally attend

17
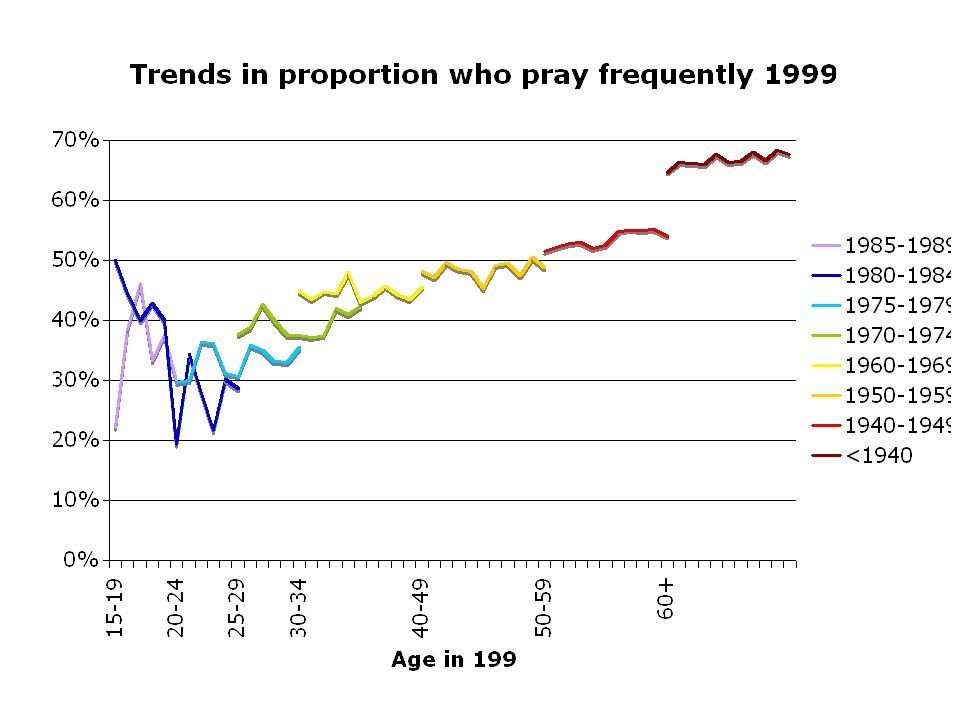
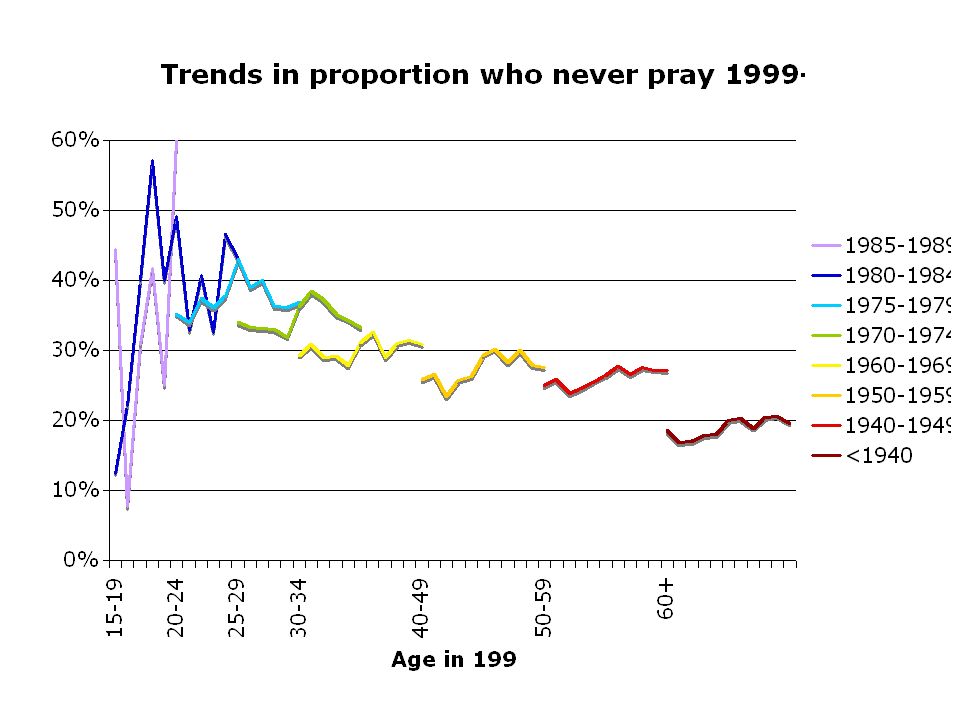
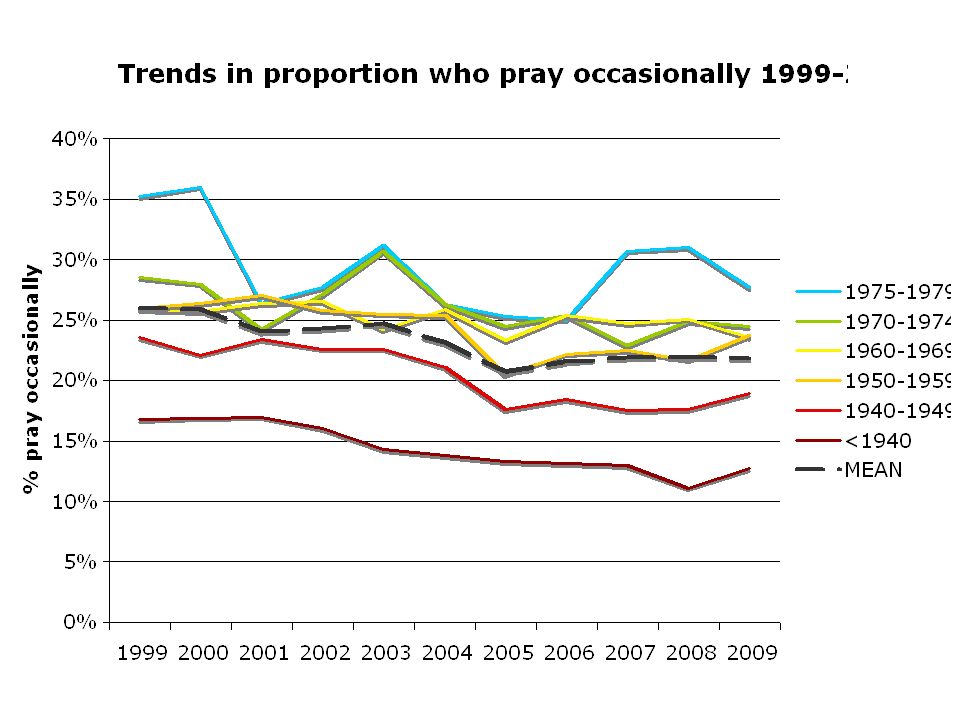
Summary of cohort-age-period prayer graphs Young adult trough in attendance & prayer Increase in within-cohort frequent pray rates -> age effect? Cross-cohort differentials -> inter-generational non- replacement Increase in those who never pray -> period effect? Slight decline in proportion who pray occasionally - opposite to attendance trend -> divergence / polarisation of prayer behaviour

18
Outline Data Cohort - age - period trends Individual flux Further research and conclusion

21
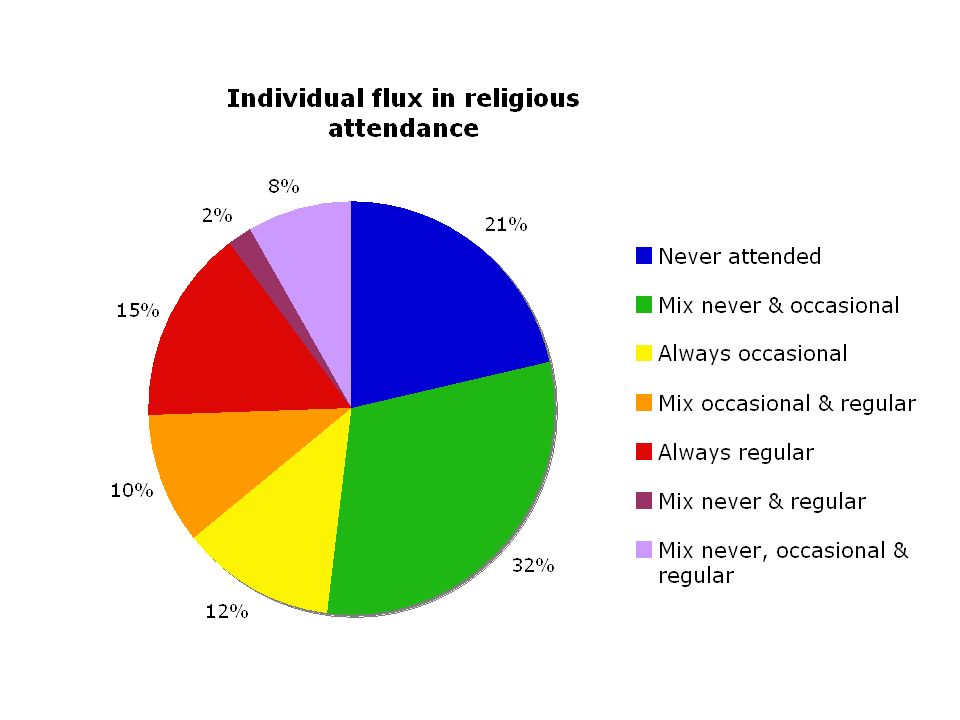
Comments The proportion of respondents who have stayed at the same level of religious attendance across all waves is 49% The proportion of respondents who have changed level of attendance at some stage is 51% NB Some people have a valid response for only 1 wave, so actual flux will be higher! The proportion of respondents who have at some time been regular attenders is 36% (cf. to annual average attendance rate of ~24%) The proportion of respondents who at some stage have been ‘never’ attenders is 62%
 The proportion of respondents who at some stage have been ‘never’ attenders is 62%.")
23
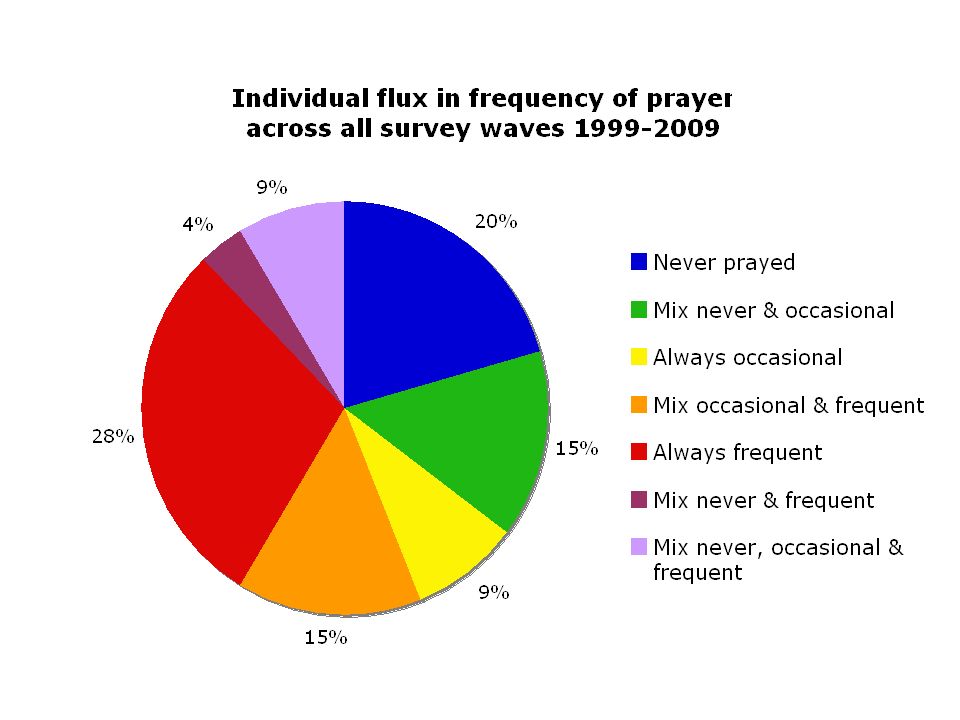
Comments The proportion of respondents who have stayed at the same level of prayer frequency across all waves is 59% ->Level of prayer is more stable than level of religious attendance The proportion of respondents who have changed level of attendance at some stage is 41% The proportion of respondents who have at some time have prayed frequently is 56% (cf. to annual average proportion of respondents who pray frequently ~45%) The proportion of respondents who at some stage have ‘never’ prayed is 47% The proportion who never attend (21%) is the same as the proportion who never pray (also 21%). However, of the respondents who regularly attend, 5% never pray! And of those who frequently pray, 22% never attend religious services!
 The proportion of respondents who at some stage have ‘never’ prayed is 47% The proportion who never attend (21%) is the same as the proportion who never pray (also 21%). However, of the respondents who regularly attend, 5% never pray. And of those who frequently pray, 22% never attend religious services!.")
24
Outline Data Age - period - cohort trends Individual flux Further research and conclusion

25
Further research Should religiosity (especially attendance) be considered a ‘time-varying variable’? Rich data source to investigate further, eg. sequence analysis to investigate individual flux in religiosity over time Associate transitions of attendance with those of prayer and affiliation Investigate gender differences Investigate increase / decrease in religiosity with life events, eg. partnering, separation, illness, birth of children, etc… Investigate if any association between change in religious attendance / prayer with change in life satisfaction Compare Swiss panel data with other countries’ data (where available)
.")
26
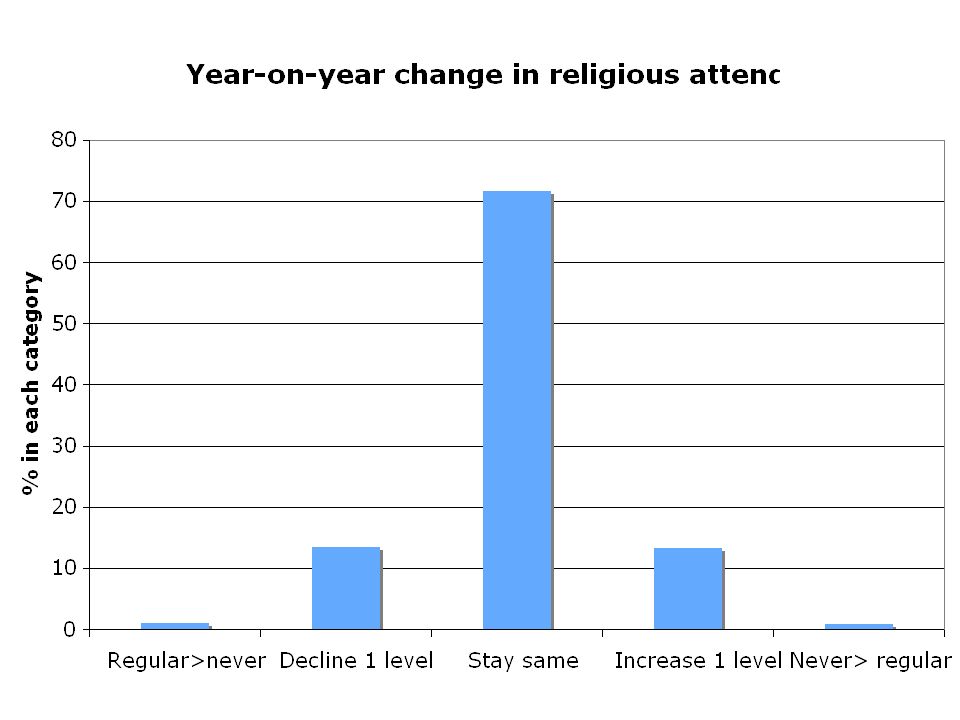
Secularisation? It depends exactly what you look at, and where you draw the boundaries. An increasing proportion of occasional attenders (decline in regular attenders and decline in ‘never’ attenders) Year-on-year the proportion who have increased their level of attendance is the same as the proportion who have declined
 Year-on-year the proportion who have increased their level of attendance is the same as the proportion who have declined.")
27
Thank you!

28
1 Protestant / Reformed 2 Roman Catholic 3 Christian Catholic 4 Other Christian 5 Jewish 6 Muslim 7 Other 8 No religion or denomination 1 Protestant+ 2 Catholic 3 Other 4 None Recoding religious affiliation

Similar presentations


 8th meeting of the European Network for the Sociological.>")


 Németh Á., Aszmann A.,Páll G., Kökönyei.>")
