Download presentation
Presentation is loading. Please wait.

1
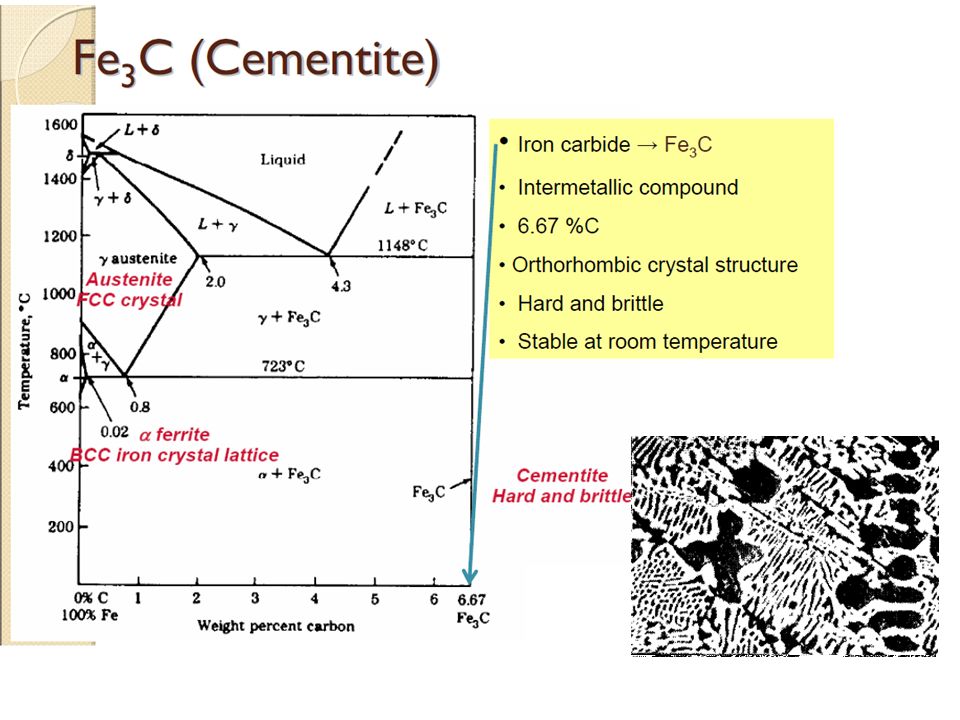
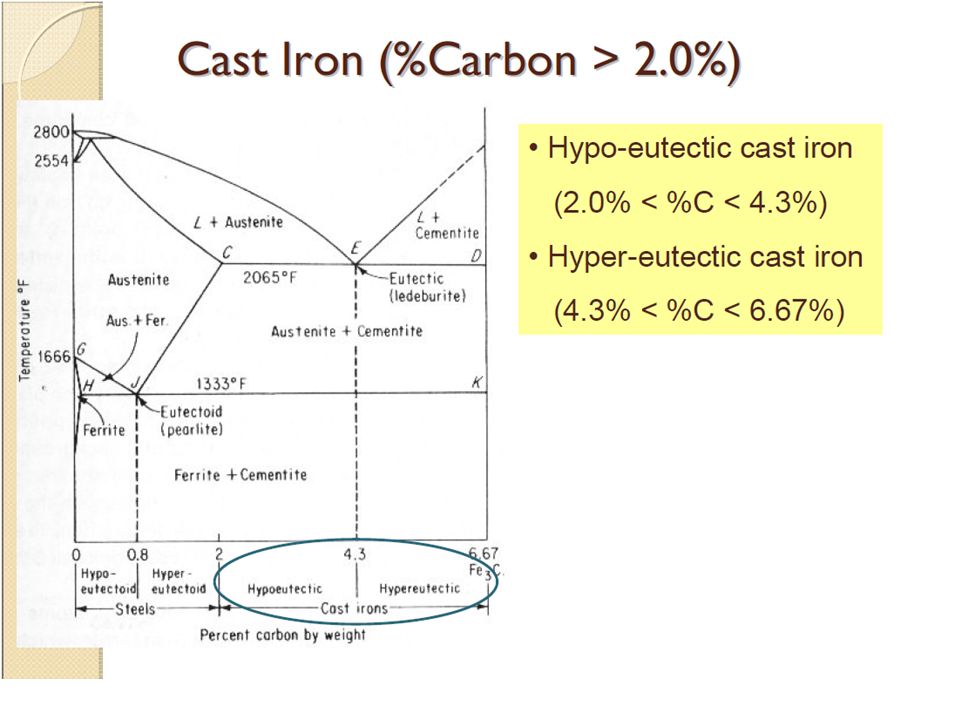
Phase Diagram Fe3C

2
100X

4
500X

5
Ferrite and Austenite Ferrite Austenite

18
Hypoeutectoid Steel T(°C) d L +L g (austenite) Fe3C (cementite) a
1600 1400 1200 1000 800 600 400 1 2 3 4 5 6 6.7 L g (austenite) +L + Fe3C a L+Fe3C d (Fe) Co , wt% C 1148°C T(°C) 727°C (Fe-C System) C0 0.76 g g r s w a = /( + ) g (1- R S a w = S /( R + ) Fe3C (1- pearlite g proeutectoid ferrite pearlite 100 mm Hypoeutectoid steel
 +L. + Fe3C. a. L+Fe3C. d. (Fe) Co , wt% C. 1148°C. T(°C) 727°C. (Fe-C. System) C g. g. r. s. w. a. = /( + ) g. (1- R. S. a. w. = S. /( R. + ) Fe3C. (1- pearlite. g. proeutectoid ferrite. pearlite. 100 mm. Hypoeutectoid. steel.")
20
Hypereutectoid Steel Fe3C (cementite) L g (austenite) +L a d T(°C) g g
1600 1400 1200 1000 800 600 400 1 2 3 4 5 6 6.7 L g (austenite) +L +Fe3C a L+Fe3C d (Fe) Co , wt%C 1148°C T(°C) (Fe-C System) g g s r w Fe3C = /( + ) g =(1- proeutectoid Fe3C 60 mm Hypereutectoid steel pearlite R S w a = /( + ) Fe3C (1- g Co 0.76
 +L. +Fe3C. a. L+Fe3C. d. (Fe) Co , wt%C. 1148°C. T(°C) (Fe-C. System) g. g. s. r. w. Fe3C. = /( + ) g. =(1- proeutectoid Fe3C. 60 mm. Hypereutectoid. steel. pearlite. R. S. w. a. = /( + ) Fe3C. (1- g. Co")
22
Iron-Carbon (Fe-C) Phase Diagram
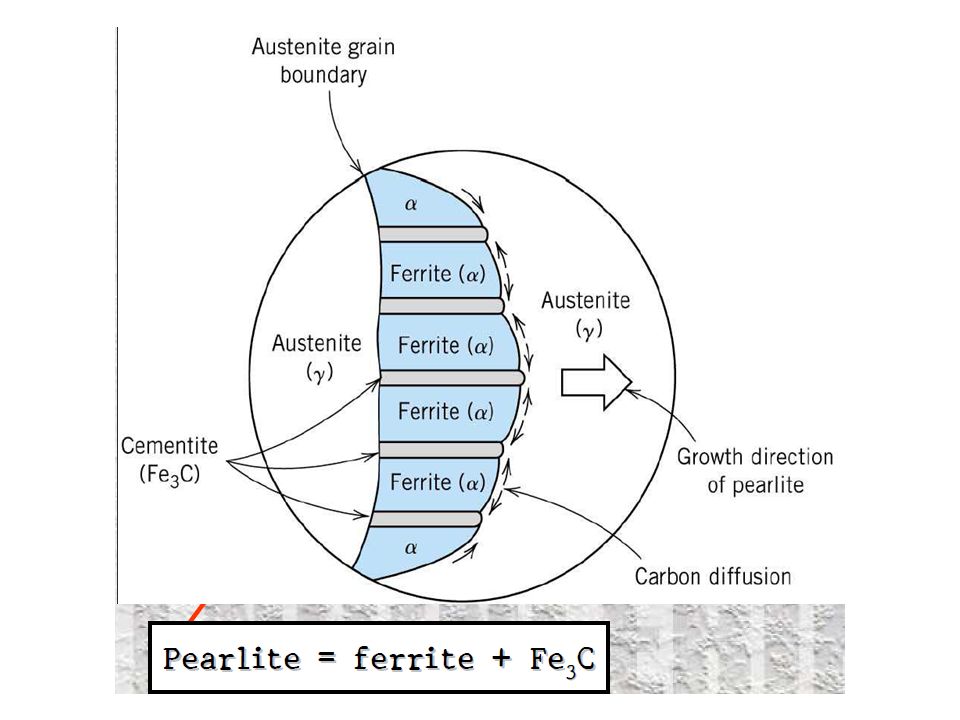
• 2 important Fe3C (cementite) 1600 1400 1200 1000 800 600 400 1 2 3 4 5 6 6.7 L g (austenite) +L +Fe3C a + L+Fe3C d (Fe) Co, wt% C 1148°C T(°C) 727°C = T eutectoid points -Eutectic (A): L Þ g + Fe3C A S R 4.30 -Eutectoid (B): g Þ a + Fe3C g 120 mm 0.76 C eutectoid B R S Fe3C (cementite-hard) a (ferrite-soft) Result: Pearlite = alternating layers of a and Fe3C phases
 L. g. (austenite) +L. +Fe3C. a. + L+Fe3C. d. (Fe) Co, wt% C. 1148°C. T(°C) 727°C = T. eutectoid. points. -Eutectic (A): L. Þ. g. + Fe3C. A. S. R Eutectoid (B): g. Þ. a. + Fe3C. g. 120 mm C. eutectoid. B. R. S. Fe3C (cementite-hard) a. (ferrite-soft) Result: Pearlite = alternating layers of. a. and Fe3C phases.")
23
Example: Phase Equilibria
For a 99.6 wt% Fe-0.40 wt% C at a temperature just below the eutectoid, determine the following composition of Fe3C and ferrite () the amount of carbide (cementite) in grams that forms per 100 g of steel the amount of pearlite and proeutectoid ferrite ()
 the amount of carbide (cementite) in grams that forms per 100 g of steel. the amount of pearlite and proeutectoid ferrite ()")
24
Solution: a) composition of Fe3C and ferrite () 3
the amount of carbide (cementite) in grams that forms per 100 g of steel CO = 0.40 wt% C Ca = wt% C CFe C = 6.70 wt% C 3 Fe3C (cementite) 1600 1400 1200 1000 800 600 400 1 2 3 4 5 6 6.7 L g (austenite) +L + Fe3C a L+Fe3C d Co , wt% C 1148°C T(°C) 727°C CO R S CFe C 3 C
 in grams that forms per 100 g of steel. CO = 0.40 wt% C Ca = wt% C CFe C = 6.70 wt% C. 3. Fe3C (cementite) L. g. (austenite) +L. + Fe3C. a. L+Fe3C. d. Co , wt% C. 1148°C. T(°C) 727°C. CO. R. S. CFe C. 3. C")
25
Co = 0.40 wt% C Ca = 0.022 wt% C Cpearlite = C = 0.76 wt% C
the amount of pearlite and proeutectoid ferrite () note: amount of pearlite = amount of g just above TE Co = 0.40 wt% C Ca = wt% C Cpearlite = C = 0.76 wt% C Fe3C (cementite) 1600 1400 1200 1000 800 600 400 1 2 3 4 5 6 6.7 L g (austenite) +L + Fe3C a L+Fe3C d Co , wt% C 1148°C T(°C) 727°C CO R S C C pearlite = 51.2 g proeutectoid = 48.8 g
 note: amount of pearlite = amount of g just above TE. Co = 0.40 wt% C Ca = wt% C Cpearlite = C = 0.76 wt% C. Fe3C (cementite) L. g. (austenite) +L. + Fe3C. a. L+Fe3C. d. Co , wt% C. 1148°C. T(°C) 727°C. CO. R. S. C C pearlite = 51.2 g proeutectoid = 48.8 g.")
26
Alloying Steel with More Elements
• Teutectoid changes: • Ceutectoid changes: Ti (wt%C) Si (°C) Mo W Ni Cr Cr Eutectoid eutectoid Si Mn Mn W Ti Mo T C Ni wt. % of alloying elements wt. % of alloying elements
 Si. (°C) Mo. W. Ni. Cr. Cr. Eutectoid. eutectoid. Si. Mn. Mn. W. Ti. Mo. T. C. Ni. wt. % of alloying elements. wt. % of alloying elements.")
32
Summary • Phase diagrams are useful tools to determine:
--the number and types of phases, --the wt% of each phase, --and the composition of each phase for a given T and composition of the system. • Alloying to produce a solid solution usually --increases the tensile strength (TS) --decreases the ductility. • Binary eutectics and binary eutectoids allow for a range of microstructures.
 --decreases the ductility. • Binary eutectics and binary eutectoids allow for. a range of microstructures.")
34
End

Similar presentations


 1600 1400 1200 1000 800 600 400 0 1234566.7 L (austenite) +L+L + Fe 3 C L+Fe 3 C C o, wt% C 1148°C T(°C)>")


,>")
? Fraction of phase determined by application of the lever rule across the entire.>")


