Download presentation
Presentation is loading. Please wait.

1
Connectionism and models of memory and amnesia Jaap Murre University of Amsterdam murre@psy.uva.nl http://www.memory.uva.nl

2
The French neurologist Ribot discovered more than 100 years ago that in retrograde amnesia one tends to loose recent memories Memory loss gradients in RA are called Ribot gradients

3
Overview Catastrophic interference and hypertransfer Brief review of neuroanatomy Outline of the TraceLink model Some simulation results of neural network model, focussing on retrograde amnesia Recent work: –Mathematical point-process model Concluding remarks

4
Catastrophic interference Learning new patterns in backpropation will overwrite all existing patterns Rehearsal is necessary McCloskey and Cohen (1989), Ratcliff (1990) This is not psychologically plausible
, Ratcliff (1990) This is not psychologically plausible")
5
Osgood surface (1949) Paired-associates in lists A and B will interfere strongly if the stimuli are similar but the responses vary If stimuli are different, little interference (i.e., forgetting) occurs Backpropagation also shows odd behavior if stimuli vary but responses are similar in lists A and B (hypertransfer)
 Paired-associates in lists A and B will interfere strongly if the stimuli are similar but the responses vary If stimuli are different, little interference (i.e., forgetting) occurs Backpropagation also shows odd behavior if stimuli vary but responses are similar in lists A and B (hypertransfer)")
6
Learned responses StimuliTarget responses (after three learning trials) Phase 1: Learning list A rist munk twup gork gomp toup wemp twub twup Phase 2: Learning interfering list B (after five learning trials) yupe munk muup maws gomp twup drin twub twub Phase 3: Retesting on list A rist munk goub gork gomp tomp wemp twub twub Hypertransfer
 Phase 1: Learning list A rist munk twup gork gomp toup wemp twub twup Phase 2: Learning interfering list B (after five learning trials) yupe munk muup maws gomp twup drin twub twub Phase 3: Retesting on list A rist munk goub gork gomp tomp wemp twub twub Hypertransfer")
7
Problems with sequential learning in backpropagation Reason 1: Strongly overlapping hidden- layer representations Remedy 1: reduce the hidden-layer representations –French, Murre (semi-distributed representations)
")
8
Problems with sequential learning in backpropagation Reason 2: Satisfying only immediate learning constraints Remedy 2: Rehearse some old patterns, when learning new ones –Murre (1992): random rehearsal –McClelland, McNaughton and O’Reilly (1995): interleaved learning
: random rehearsal –McClelland, McNaughton and O’Reilly (1995): interleaved learning")
9
Final remarks on sequential learning Two-layer ‘backpropagation’ networks do show plausible forgetting Other learning networks do not exhibit catastrophic interference: ART, CALM, Kohonen Maps, etc. It is not a necessary condition of learning neural networks; it mainly affects backpropagation The brain does not do backpropagation and therefore does not suffer from this problem

10
Models of amnesia and memory in the brain TraceLink Point-process model Chain-development model

11
Neuroanatomy of amnesia Hippocampus Adjacent areas such as entorhinal cortex and parahippocampal cortex Basal forebrain nuclei Diencephalon

12
The position of the hippocampus in the brain

13
Hippocampal connections

14
Hippocampus has an excellent overview of the entire cortex

15
Trace-Link model: structure

16
System 1: Trace system Function: Substrate for bulk storage of memories, ‘association machine’ Corresponds roughly to neocortex

17
System 2: Link system Function: Initial ‘scaffold’ for episodes Corresponds roughly to hippocampus and certain temporal and perhaps frontal areas

18
System 3: Modulatory system Function: Control of plasticity Involves at least parts of the hippocampus, amygdala, fornix, and certain nuclei in the basal forebrain and in the brain stem

19
Stages in episodic learning

20
Dreaming and consolidation of memory Theory by Francis Crick and Graeme Mitchison (1983) Main problem: Overloading of memory Solution: Reverse learning leads to removal of ‘obsessions’ “We dream in order to forget”
 Main problem: Overloading of memory Solution: Reverse learning leads to removal of ‘obsessions’ We dream in order to forget")
21
Dreaming and memory consolidation When should this reverse learning take place? During REM sleep –Normal input is deactivated –Semi-random activations from the brain stem –REM sleep may have lively hallucinations

22
Consolidation may also strengthen memory This may occur during deep sleep (as opposed to REM sleep) Both hypothetical processes may work together to achieve an increase in the definition of representations in the cortex
 Both hypothetical processes may work together to achieve an increase in the definition of representations in the cortex")
23
Recent data by Matt Wilson and Bruce McNaughton (1994) 120 neurons in rat hippocampus PRE: Slow-wave sleep before being in the experimental environment (cage) RUN: During experimental environment POST: Slow-wave sleep after having been in the experimental environment
 120 neurons in rat hippocampus PRE: Slow-wave sleep before being in the experimental environment (cage) RUN: During experimental environment POST: Slow-wave sleep after having been in the experimental environment")
24
Wilson en McNaughton Data PRE: Slow-wave sleep before being in the experimental environment (cage) RUN: During experimental environment POST: Slow-wave sleep after having been in the experimental environment
 RUN: During experimental environment POST: Slow-wave sleep after having been in the experimental environment")
25
Some important characteristics of amnesia Anterograde amnesia (AA) –Implicit memory preserved Retrograde amnesia (RA) –Ribot gradients Pattern of correlations between AA and RA –No perfect correlation between AA and RA
 –Implicit memory preserved Retrograde amnesia (RA) –Ribot gradients Pattern of correlations between AA and RA –No perfect correlation between AA and RA")
26
x retrograde amnesia anterograde amnesia lesionpresentpast Normal forgetting

27
An example of retrograde amnesia patient data Kopelman (1989) News events test
 News events test")
28
Retrograde amnesia Primary cause: loss of links Ribot gradients Shrinkage

29
Anterograde amnesia Primary cause: loss of modulatory system Secondary cause: loss of links Preserved implicit memory

30
Semantic dementia The term was adopted recently to describe a new form of dementia, notably by Julie Snowden et al. (1989, 1994) and by John Hodges et al. (1992, 1994) Semantic dementia is almost a mirror- image of amnesia
 and by John Hodges et al. (1992, 1994) Semantic dementia is almost a mirror- image of amnesia.")
31
Neuropsychology of semantic dementia Progressive loss of semantic knowledge Word-finding problems Comprehension difficulties No problems with new learning Lesions mainly located in the infero-lateral temporal cortex but (early in the disease) with sparing of the hippocampus
 with sparing of the hippocampus")
32
Severe loss of trace connections Stage-2 learning proceeds as normal Stage 3 learning strongly impaired Non-rehearsed memories will be lost No consolidation in semantic dementia

33
Semantic dementia in TraceLink Primary cause: loss of trace-trace connections Stage-3 (and 4) memories cannot be formed: no consolidation The preservation of new memories will be dependent on constant rehearsal
 memories cannot be formed: no consolidation The preservation of new memories will be dependent on constant rehearsal")
34
Connectionist implementation of the TraceLink model With Martijn Meeter from the University of Amsterdam

35
Some details of the model 42 link nodes, 200 trace nodes for each pattern –7 nodes are active in the link system –10 nodes in the trace system Trace system has lower learning rate that the link system

36
How the simulations work: One simulated ‘day’ A new pattern is activated The pattern is learned Because of low learning rate, the pattern is not well encoded at first in the trace system A period of ‘simulated dreaming’ follows –Nodes are activated randomly by the model –This random activity causes recall of a pattern –A recalled pattern is than learned extra

37
(Patient data) Kopelman (1989) News events test
 Kopelman (1989) News events test")
38
A simulation with TraceLink

39
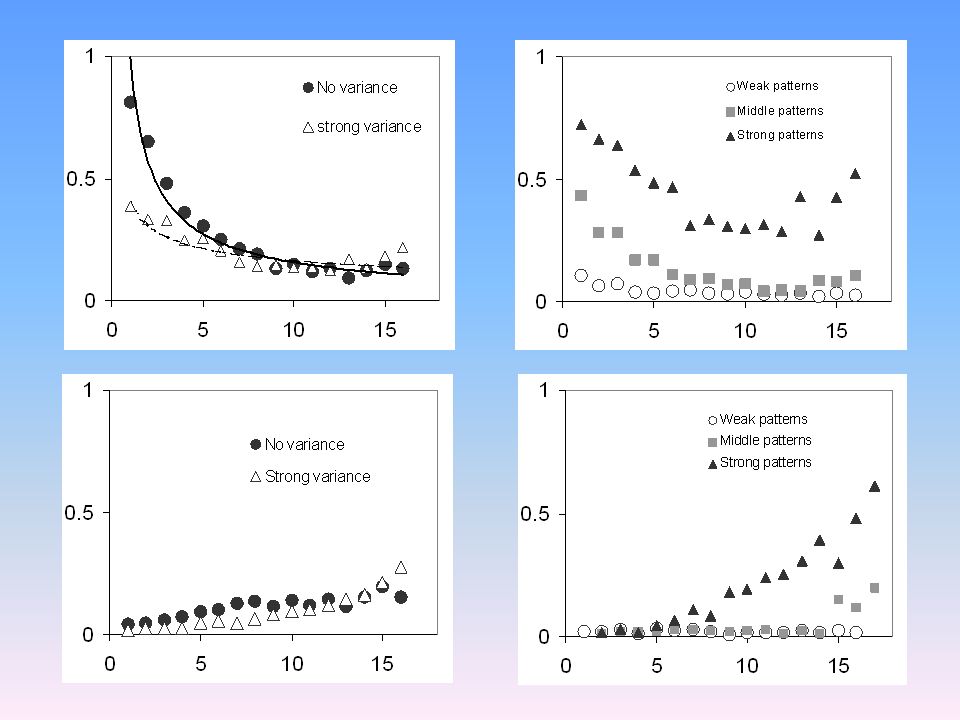
Frequency of consolidation of patterns over time

40
Strongly and weakly encoded patterns Mixture of weak, middle and strong patterns Strong patterns had a higher learning parameter (cf. longer learning time)
.")
42
Transient Global Amnesia (TGA) (Witnessed onset) of severe anterograde and retrograde amnesia Resolves within 24 hours Retrograde amnesia may have Ribot gradients Hippocampal area is most probably implicated
 (Witnessed onset) of severe anterograde and retrograde amnesia Resolves within 24 hours Retrograde amnesia may have Ribot gradients Hippocampal area is most probably implicated")
43
Transient Global Amnesia (TGA)
")
44
Other simulations Focal retrograde amnesia Levels of processing Semantic dementia Implicit memory More subtle lesions (e.g., only within-link connections, cf. CA1 lesions)
.")
45
The Memory Chain Model: a very abstract neural network With Antonio Chessa from the University of Amsterdam

46
Abstracting TraceLink (level 1) Model formulated within the mathematical framework of point processes Generalizes TraceLink’s two-store approach to multiple neural ‘stores’ –trace system –link system –working memory, short-term memory, etc. A store corresponds to a neural process or structure

47
Learning and forgetting as a stochastic process: 1-store example A recall cue (e.g., a face) may access different aspects of a stored memory If a point is found in the neural cue area, the correct response (e.g., the name) can be given Learning ForgettingSuccessful Recall Unsuccessful Recall
 may access different aspects of a stored memory If a point is found in the neural cue area, the correct response (e.g., the name) can be given Learning ForgettingSuccessful Recall Unsuccessful Recall")
48
Neural network interpretation Jo Brand

49
Single-store point process The expected number of points in the cue area after learning is called This is directly increased by learning and also by more effective cueing At each time step, points die The probability of survival of a point is denoted by a Link systemRetrieval a Survival probability

50
Some aspects of the point process model Model of simultaneous learning and forgetting Clear relationship between signal detection theory (d'), recall (p), savings (Ebbinghaus’ Q), and Crovitz-type distribution functions Multi-trial learning and multi-trial savings Currently applied to over 250 experiments in learning and forgetting, since 1885
, recall (p), savings (Ebbinghaus’ Q), and Crovitz-type distribution functions Multi-trial learning and multi-trial savings Currently applied to over 250 experiments in learning and forgetting, since 1885")
51
Forgetting curve If we need to find at least one point we obtain the following curve (one-store case): We predict a flex point when the initial recall is at least is the intensity of the process (expected number of points) and a is the decay parameter
: We predict a flex point when the initial recall is at least is the intensity of the process (expected number of points) and a is the decay parameter")
52
Example: Single-store model fitted to short-term forgetting data R 2 = 0,985

53
Flex points versus initial retention level: an analysis of 200 data sets 0.63: ‘overlearning threshold’

54
Multi-store generalization Information about the current event passes through many neural ‘stores’ The retina, for example, holds a lot of information very briefly The cerebral cortex holds very little information (of the current event) for a very long time
 for a very long time")
55
General principles of the PPM multi-store model A small part of the information is passed to the next store before it decays completely Subsequent stores hold information for longer time periods: slower decay rates in ‘higher’ stores

56
Two-store model While neural store 1 is decaying (with rate a 1 ) it induces new points (representations) in store 2 Induction rate is linear with the intensity in store 1 and has induction rate 2 The points in store immediately start to decay as well (at a lower rate a 2 )
 it induces new points (representations) in store 2 Induction rate is linear with the intensity in store 1 and has induction rate 2 The points in store immediately start to decay as well (at a lower rate a 2 )")
57
Example of two neural stores Store 1: firing neural groups Store 2: synaptic connections between the neural groups Other interpretation are possible as well, e.g.: –Store 1: hippocampus –Store 2: cerebral cortex Skip

58
Example of two neural stores: encoding phase H Store 1 Additional cue area Stimulus

59
Storage phase: decay of neural groups and Hebbian learning Store 2

60
?R Q Recall phase: retrieval through cue Q Skip

61
Decomposition of intensity (t) into encoding, storage, and retrieval
 into encoding, storage, and retrieval")
62
The contributions of S individual neural stores can simply be added

63
Two-store model retention function: r 12 (t)= r 1 (t)+ r 2 (t)
= r 1 (t)+ r 2 (t)")
64
The retention function for the third-store of a three-store model

65
Recall probability p(t) as a function of different learning times l is the learning rate l is the learning time r(t) is the decline function t time since learning
 as a function of different learning times l is the learning rate l is the learning time r(t) is the decline function t time since learning")
66
Saturation assumption

67
Hellyer (1962). Recall as a function of 1, 2, 4 and 8 presentations Two-store model with saturation. Parameters are 1 = 7.4, a 1 = 0.53, 2 = 0.26, a 2 = 0.31, r max = 85; R 2 =.986 Skip

68
Amnesia: animal data Retrograde amnesia

69
Cho & Kesner (1996). (mice) R 2 =0.96
. (mice) R 2 =0.96")
70
Summary of animal data

71
Frankland et al. (2001) study -CaMKB-dependent plasticity (in neocortex) switched off in knock-out mice No LTP measurable in neocortex but LTP in hippocampus was largely normal Forgetting curves with different levels of initial learning were measured A learning curve was measured Assumption: use r 1[2] (t) for knock-out mice
 study -CaMKB-dependent plasticity (in neocortex) switched off in knock-out mice No LTP measurable in neocortex but LTP in hippocampus was largely normal Forgetting curves with different levels of initial learning were measured A learning curve was measured Assumption: use r 1[2] (t) for knock-out mice.")
72
Forgetting after 3 shocks, using three parameters

73
Using the same three parameters and a massed-learning correction.

74
Controls receive 1 shock, experimental animals 3 shocks (no new free parameters).
.")
75
Repeated learning for experimental animals (no new free parameters)
")
76
Summary of ‘cortical amnesia’. Using only 4 parameters for all curves (R 2 = 0.976).
.")
77
Amnesia: human data

78
Application to retrograde amnesia Data on clinical tests cannot be used for direct modeling The reason is that remote time periods in these tests are typically made easier Data for the different time periods are therefore not equivalent Our model may offer a solution here: the relative retrograde gradient or rr-gradient

79
Sometimes this problems occurs with animal data as well Wiig, Cooper, and Bear (1996) Used non-counterbalanced stimuli
 Used non-counterbalanced stimuli")
80
Wiig, Cooper & Bear (1996). (rats) R 2 =0.28
. (rats) R 2 =0.28")
81
Wiig, Cooper & Bear (1996). (rats) with rr-gradient: R 2 =0.84
. (rats) with rr-gradient: R 2 =0.84")
82
Define the relative retrograde gradient or rr-gradient

83
rr-gradient (continued)
")
84
The rr-gradient does not have parameters for learning strength 1 or cue strength q

85
Recall probability p(t) must transformed to retention r(t)
 must transformed to retention r(t)")
86
Albert et al. (1979), naming of famous faces
, naming of famous faces")
87
Squire, Haist, and Shimamura (1989), recall of public events
, recall of public events")
88
Concluding remarks In this presentation, we have shown models at two levels of abstraction: –Mathematical, based on point processes –Computational, based on simplified neural networks

89
Concluding remarks These models incorporate data from: –Neuroanatomy and neurophysiology –Neurology and neuropsychology –Experimental psychology The aim is to integrate these various sources of data into a single theory that is implemented in a series of coordinated models

90
Concluding remarks Given that the brain is exceedingly complex, we need models at various levels of abstraction to aid our understanding This is especially true when trying to unravel the link between the brain and human behavior, which is extremely complex itself Hence, models are of particular use in the new, interdisciplinary field of cognitive neuroscience

Similar presentations