Download presentation
Presentation is loading. Please wait.

1
Time of Death: Modeling Time-varying Natural Mortality in Fish Populations Phil Ganz 1 Terrance Quinn II 1 Peter Hulson 2 1 Juneau Center, School of Fisheries and Ocean Sciences, University of Alaska Fairbanks, 17101 Point Lena Loop Road, Juneau, AK 99801, USA 2 NOAA National Marine Fisheries Service, Alaska Fisheries Science Center, Auke Bay Laboratories, 17109 Point Lena Loop Road, Juneau, AK 99801, USA Photos: kevskewl.files.wordpress.com, http://www.fishbase.us/

2
Statistical catch-at-age models Age Year2012 2013 2014 2015 2016 1 2 3 4 5 Abundance-at-age

3
Statistical catch-at-age models Two main sources of data: –Commercial fisheries Scientific surveys http://www.alaskafishradio.comPhoto credit: Phil Ganz

4
Statistical catch-at-age models Two main types of data: Abundance/weight Age composition http://www.lanierstripedbasscoalition.org http://cdn.lightgalleries.net

5
Statistical catch-at-age model Highly non-linear Some key parameters and values: –Natural mortality (M) –Fishing mortality (F) –Survey catchability (q): scales the catch from the survey (I) to that of the total abundance (N), so I=qN –Selectivity (s): the proportion of fish at a given age that are vulnerable to fishing gear
 –Fishing mortality (F) –Survey catchability (q): scales the catch from the survey (I) to that of the total abundance (N), so I=qN –Selectivity (s): the proportion of fish at a given age that are vulnerable to fishing gear")
6
Statistical catch-at-age models Trying to estimate and predict: –Abundance/weight Recruitment, or juvenile fish: sometimes modeled as a function of the number of mature fish, sometimes modeled as random. Adults (mature and immature) –Age composition Used with maturity data to estimate reproductive potential
 –Age composition Used with maturity data to estimate reproductive potential.")
7
Statistical catch-at age models Balance between precision and parsimony:

8
Baranov catch equation Catch Abundance Proportion that dies Proportion of deaths that are due to fishing

9
Total mortality vs maximum age Hoenig 1983

10
Relating natural mortality to growth Von Bertalanffy growth: It follows (Beverton, Holt, and others): –M related to K via t max –Can plot M against K, use as predictor
: –M related to K via t max –Can plot M against K, use as predictor")
11
The problem Misspecifying M results in bias – Clark 1999 “The magnitude of natural mortality relates directly to the productivity of the stock, the yields that can be obtained, optimal exploitation rates, management quantities, and reference points. Unfortunately, natural mortality is also one of the most difficult quantities to estimate.” – Brodziak et al. 2011

12
Varying natural mortality In general: This presentation: Parameters are confounded with each other http://vignette1.wikia.nocookie.net/

13
Two Proposed Methods Covariates –i.e. Use more data Correlated error –i.e. Look at the data in a different way Jiao et al. 2012

14
Covariates to natural mortality Predation –Herring: Teerlink et al. in revision. – Lake trout: Pycha 1980; James Bence, pers. comm. Disease –Marty et al. 2010 Marty et al. 2010 www.fhwa.dot.gov/

15
How precise does a covariate need to be? Sablefish Population constructed from most recent age structured assessment (Hanselman et al. 2014) 30 year simulation Specified scenarios for: –Natural morality –Precision of covariate www.flickr.com/photos/jikegami
 30 year simulation Specified scenarios for: –Natural morality –Precision of covariate")
16
Simulated “data” Two sources: –Survey –Commercial Two types: –Abundance –Age M covariate Photos: www.priweb.org

17
Natural mortality scenarios Error + 20 iterations

18
Covariate scenarios Error+

19
All scenarios Covariate error+ M Error +

20
Estimation Statistical catch-at-age model Same parameterization as operating model Optimized using automatic differentiation:

21
Results

22
Natural Mortality Covariate error M Error + +

23
Total biomass 1985-2014 Covariate error M Error + +

24
Total biomass 2014 Covariate error M Error + +

25
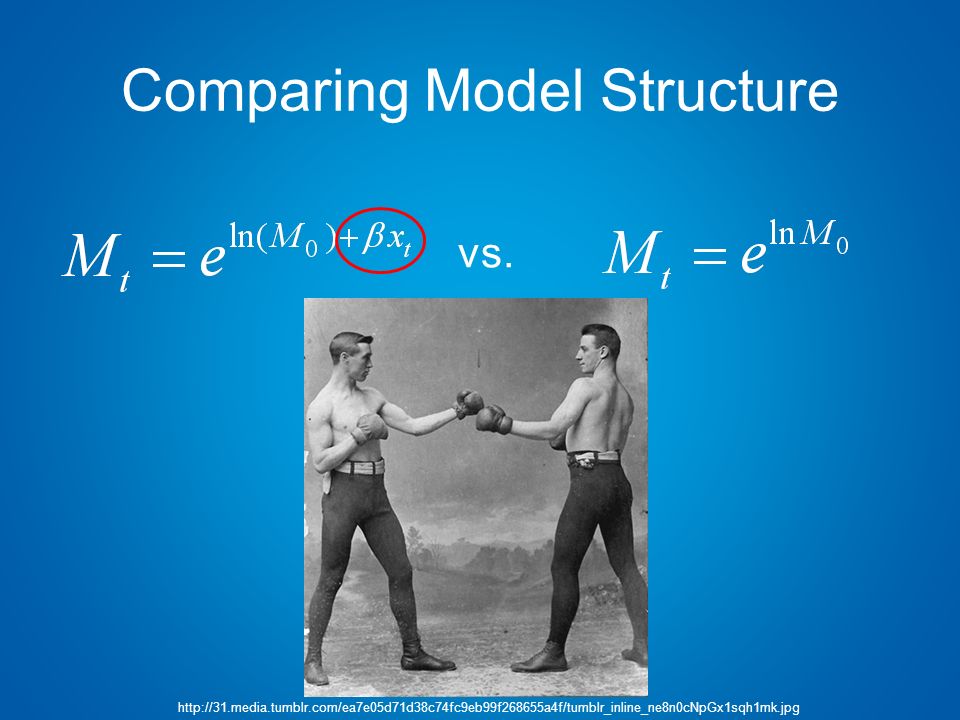
Comparing Model Structure vs. http://31.media.tumblr.com/ea7e05d71d38c74fc9eb99f268655a4f/tumblr_inline_ne8n0cNpGx1sqh1mk.jpg
26
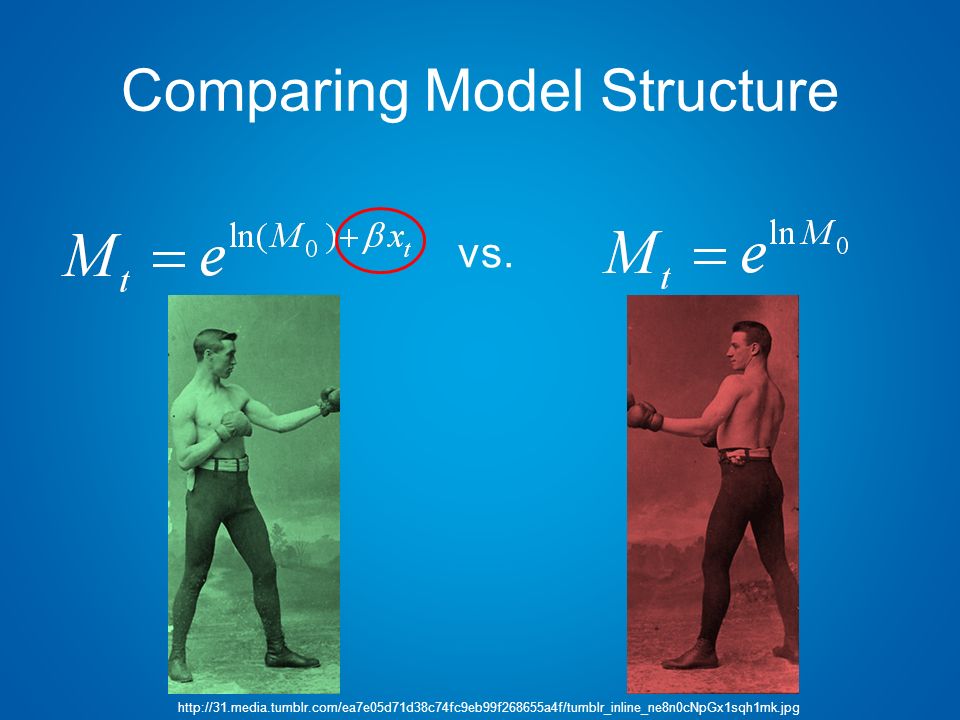
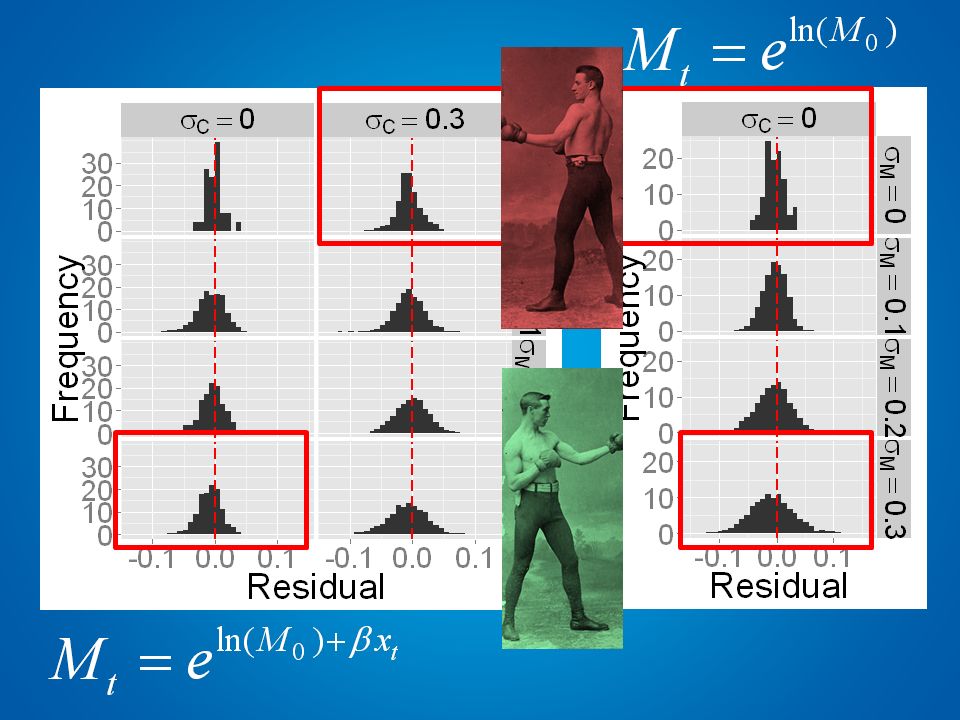
Comparing Model Structure vs. http://31.media.tumblr.com/ea7e05d71d38c74fc9eb99f268655a4f/tumblr_inline_ne8n0cNpGx1sqh1mk.jpg
28
Conclusion Statistical catch-at-age models in general: –We need to make simplifying assumptions –What simplifying assumptions are acceptable? Sablefish simulation: –The covariate method is effective, but as errors increase, precision decreases. –Not including the covariate can be more precise, if the covariate is very imprecise and natural mortality is constant.

29
Conclusions Future directions –Trending natural mortality –Correlated error structures Random effects Random walk

30
¿Preguntas? Thank you!: Terry Quinn Pete Hulson Dana Hanselman Pedro Gajardo You for listening Funding: National Marine Fisheries Service Stock Assessment Improvement Plan github.com/michiganz

31
References Brodziak, J., Ianelli, J., Lorenzen, K., & Methot, R. D. J. 2011. Estimating Natural Mortality in Stock Assessment Applications. st.nmfs.noaa.gov (p. 38). U.S. Dep. Commer. Retrieved from https://www.st.nmfs.noaa.gov/st4/documents/MworkshopReport_final.pdf Clark, W. G. 1999. Effects of an erroneous natural mortality rate on a simple age-structured stock assessment. Canadian Journal of Fisheries and Aquatic Sciences, 56(10), 1721-1731. Hanselman, D.H., C. Lunsford, and C. Rodgveller. 2014. Assessment of the sablefish stock in Alaska, pp. 283-424. In Stock assessment and fishery evaluation report for the groundfish resources of the GOA and BS/AI for 2015. North Pacific Fishery Management Council, Anchorage, AK. Hoenig, J. M. 1983. Empirical use of longevity data to estimate mortality-rates. Fishery Bulletin, 81(4), 898-903. Jiao, Y., Smith, E. P., O'Reilly, R., & Orth, D. J. (2012). Modelling non-stationary natural mortality in catch-at-age models. ICES Journal of Marine Science: Journal du Conseil, 69(1), 105-118. Marty, G.D., Hulson, P.-J.F., Miller, S.E., Quinn, T.J., II, Moffitt, S.D., and Merizon, R.A. 2010. Failure of population recovery in relation to disease in Pacific herring. Diseases of Aquatic Organisms 90: 1-14. Pycha, R. L. 1980. Changes in mortality of lake trout (Sulvelinus namaycush) in Michigan waters of Lake Superior in relation to sea lamprey (Petromyzon marinus) predation, 1968-78. Can. J. Fish. Aquat. Sci. 37: 2063-2073. Teerlink, S.F., Quinn, T.J. II, Straley, J.M., and Ziegesar, O.V. The ecological importance of humpback whale predation on herring biomass in Prince William Sound as determined by model covariation. In Revision.
. U.S. Dep. Commer. Retrieved from Clark, W. G Effects of an erroneous natural mortality rate on a simple age-structured stock assessment. Canadian Journal of Fisheries and Aquatic Sciences, 56(10), Hanselman, D.H., C. Lunsford, and C. Rodgveller Assessment of the sablefish stock in Alaska, pp In Stock assessment and fishery evaluation report for the groundfish resources of the GOA and BS/AI for North Pacific Fishery Management Council, Anchorage, AK. Hoenig, J. M Empirical use of longevity data to estimate mortality-rates. Fishery Bulletin, 81(4), Jiao, Y., Smith, E. P., O Reilly, R., & Orth, D. J. (2012). Modelling non-stationary natural mortality in catch-at-age models. ICES Journal of Marine Science: Journal du Conseil, 69(1), Marty, G.D., Hulson, P.-J.F., Miller, S.E., Quinn, T.J., II, Moffitt, S.D., and Merizon, R.A Failure of population recovery in relation to disease in Pacific herring. Diseases of Aquatic Organisms 90: Pycha, R. L Changes in mortality of lake trout (Sulvelinus namaycush) in Michigan waters of Lake Superior in relation to sea lamprey (Petromyzon marinus) predation, Can. J. Fish. Aquat. Sci. 37: Teerlink, S.F., Quinn, T.J. II, Straley, J.M., and Ziegesar, O.V. The ecological importance of humpback whale predation on herring biomass in Prince William Sound as determined by model covariation. In Revision..")
Similar presentations


 Ciaran Kelly (Fisheries Science Services, Marine Institute) Edward.>")


 Center for the Advancement of Population.>")


