Download presentation
Presentation is loading. Please wait.

2
RSPA/Volpe Center Arrival/Departure Capacity Tradeoff Optimization: a Case Study at the St. Louis Lambert International Airport (STL) Dr. Eugene P. Gilbo E-mail: gilbo@volpe.dot.gov tel.: (617) 494-2567 5 th USA/Europe Air Traffic Management R&D Seminar June 23 – 27, 2003 Budapest, Hungary
 Dr. Eugene P. Gilbo tel.: (617) th USA/Europe Air Traffic Management R&D Seminar June 23 – 27, 2003 Budapest, Hungary.")
3
RSPA/Volpe Center Goals of the Study Test the Feasibility of the Airport Arrival and Departure Capacity Tradeoff Optimization Approach. Test the Arrival/Departure Tradeoff Optimization Tool as an Automated Decision Support Tool for Improving Arrival and Departure TFM Strategies at Airports and Collaborative Decision Making. Evaluate Potential Benefits of the Optimization Approach for Improving Airport Capacity Utilization, Increasing the Airport Throughput, and Reducing Delays. Design and Propose an Operational Concept for Using the Tool. Obtain Feedback and Suggestions from STL TRACON and ATC Tower as Well as TWA Specialists to Improve the Tool.

4
RSPA/Volpe Center Overall Design of the Study 1.Volpe Center Designs and Develops the Arrival/Departure Tradeoff Optimization Tool Using Both ETMS and Airport- Specific Data. 2.STL TFM Specialists Provide the Volpe Center with the Full Set of Runway Configurations and Their AARs and ADRs (Tradeoff Ranges) for Various Weather Conditions. 3. The Study is Based on: - Comparative Analysis of Optimal TFM Strategies Calculated by the Tool and those Proposed by the STL Traffic Management Specialists for the Days with Heavy Traffic Demand 4.The Study is a Collaborative Effort Involving the Specialists from Volpe Center, FAA and TWA. - On-line Testing and “Playing” with the Tool by TFM Specialists.
 for Various Weather Conditions. 3. The Study is Based on: - Comparative Analysis of Optimal TFM Strategies Calculated by the Tool and those Proposed by the STL Traffic Management Specialists for the Days with Heavy Traffic Demand 4.The Study is a Collaborative Effort Involving the Specialists from Volpe Center, FAA and TWA. - On-line Testing and Playing with the Tool by TFM Specialists..")
5
RSPA/Volpe Center Specifics of Arrival/Departure Capacity Curves at STL 1.Each Runway Configuration at STL has a Set of (Arrival Capacity/Departure Capacity) Pairs with the Trade-off Relationship Between its Components. 2.The Range of Arrival/Departure Capacity Trade-off Depends on Runway Configuration and Weather-Related Operational Category. 3.The Total Capacity (Arrival plus Departure) of a Runway Configuration is CONSTANT within a Trade-off Area with Various Allocation of Arrival and Departure Components.
 of a Runway Configuration is CONSTANT within a Trade-off Area with Various Allocation of Arrival and Departure Components..")
6
RSPA/Volpe Center STL, Runway Configuration A30LR, 24 / D30LR, VIS 0 1015 5 20 25 5 10 15 20 25 # of dep/15min # of arr/15min Airport Capacity Arr.Dep. 8 18 9 17 10 16 11 15 12 14 13 14 12 15 11 16 10 17 9 18 8 Arrival Capacity Departure Capacity (8, 18) (18, 8) Total (Arrival + Departure) Capacity = 26 ops / 15min (104 ops/hr )
 (18, 8) Total (Arrival + Departure) Capacity = 26 ops / 15min (104 ops/hr ).")
7
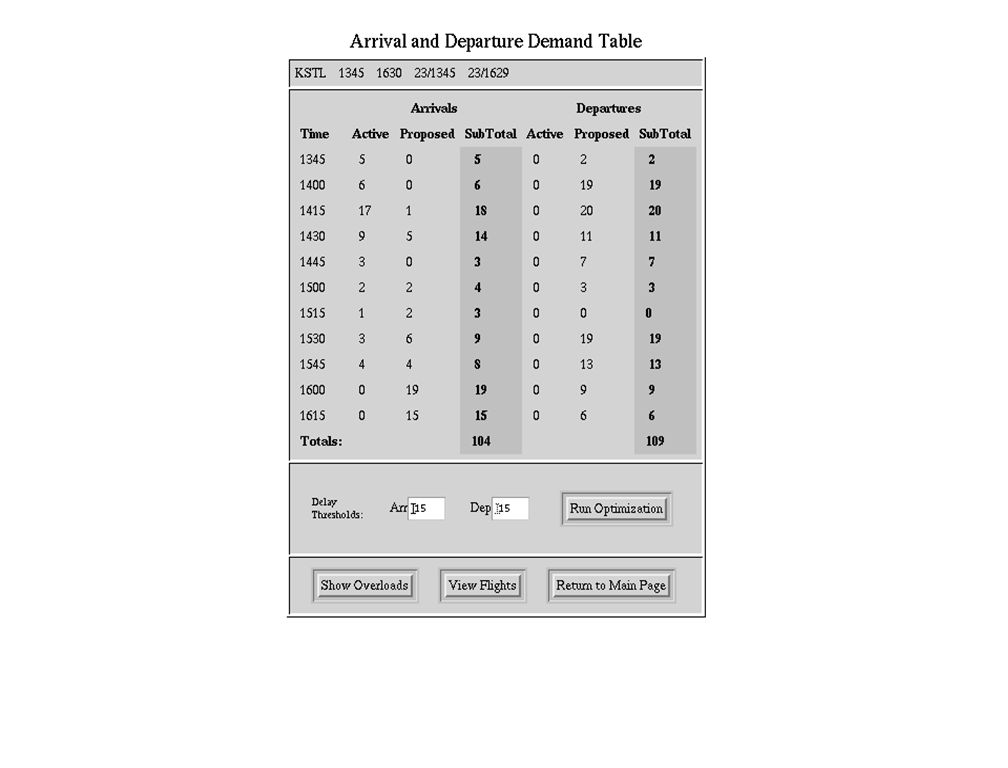
RSPA/Volpe Center Dynamic Optimization of Airport Arrival/Departure Capacity Trade-off and Airport Throughput Criterion:Minimum Weighted Sum of Total Arrival and Departure Queues (Delays) Input:Time Period of Interest Predicted Arrival and Departure Traffic Demand Weather Conditions Schedule of Runway Configurations and Their Arrival/Departure Capacity Curves Output: Airport Arrival and Departure Rates (Capacities) Arrival and Departure Traffic Flow Compatible With the Optimal Rates
 Input:Time Period of Interest Predicted Arrival and Departure Traffic Demand Weather Conditions Schedule of Runway Configurations and Their Arrival/Departure Capacity Curves Output: Airport Arrival and Departure Rates (Capacities) Arrival and Departure Traffic Flow Compatible With the Optimal Rates")
8
RSPA/Volpe Center Optimization Criteria Minimum Weighted Sum of Arrival and Departure Cumulative Queues: minimize [ α Cumul. Arr. Queue + (1 – α) Cumul. Dep. Queue ], arr.cap, dep. cap Minimum Weighted Sum of Total Arrival and Departure Delays: minimize [ α Total Arr. Delay + (1 – α) Total Dep. Delay ], arr.cap, dep. cap α - Arrival Priority Parameter
 Cumul. Dep. Queue ], arr.cap, dep. cap Minimum Weighted Sum of Total Arrival and Departure Delays: minimize [ α Total Arr. Delay + (1 – α) Total Dep. Delay ], arr.cap, dep. cap α - Arrival Priority Parameter.")
9
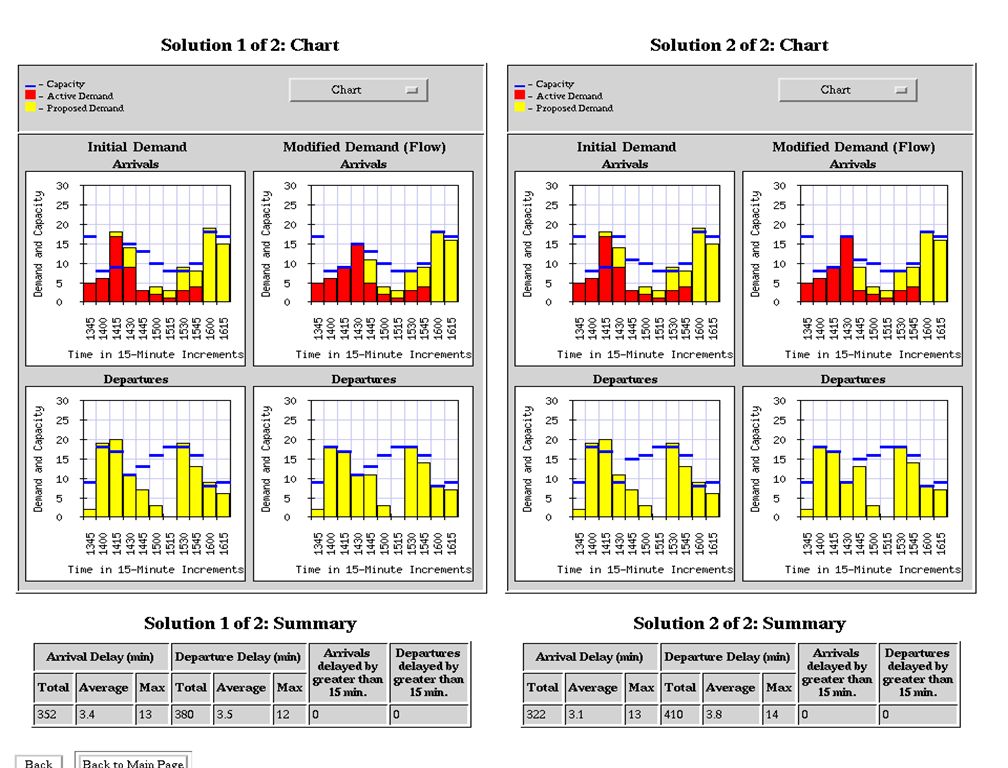
RSPA/Volpe Center As a Result of CONSTANT Total Capacity Within the Arrival/Departure Tradeoff Area, There is a Possibility of Multiple Optimal Solutions that Minimize the Total Arrival Plus Departure Cumulative Queue (α = 0.5 )
")
10
RSPA/Volpe Center Table 2. TFM Strategy proposed by the STL specialists, 7/21/00, 1745 - 1900 Time Initial DemandA/p Capacity Traffic Flow Queue Arr.Dep.Arr.Dep.Arr.Dep.Arr.Dep. 1745 – 1800 10 5 13 10 5 0 0 1800 – 1815 13 11 13 11 0 0 1815 – 1830 16 13 3 3 1830 – 1845 7 19 10 16 10 16 0 6 1845 – 1900 4 13 8 18 4 0 1 TOTAL: 50 64 50 63 3 10 TFM Strategy Proposed by the STL Specialists, 7/21/00, 1745 - 1900 Total Queue arr. dep. Total Delay (min) arr. dep. Ave. Delay per Flight (min) arr. dep. 3 10 arr. + dep. 13 45 150 195 0.9 2.3 SUMMARY:
 arr. dep. Ave. Delay per Flight (min) arr. dep arr. + dep SUMMARY:.")
11
RSPA/Volpe Center Examples of Multiple Optimal TFM Strategies, 7/21/00, 1745 - 1900 (provided 8% reduction in the total arrival plus departure delay) Time Initial Demand A/p CapacityTraffic Flow Queue Arr.Dep.Arr.Dep.Arr.Dep.Arr.Dep. 1745 – 1800 10 5 13 10 5 0 0 1800 – 1815 13 11 13 11 0 0 1815 – 1830 16 14 12 14 12 2 4 1830 – 1845 7 19 8 18 8 1 5 1845 – 1900 4 13 8 18 5 0 0 TOTAL: 50 64 50 64 3 9 Optimal TFM Strategy # 1, 7/21/00, 1745 - 1900 Total Queue arr. dep. Total Delay (min) arr. dep. Ave. Delay per Flight (min) arr. dep. 3 9 arr. + dep. 12 45 135 180 0.9 2.1 SUMMARY:
 arr. dep. Ave. Delay per Flight (min) arr. dep. 3 9 arr. + dep SUMMARY:.")
12
RSPA/Volpe Center Time Initial DemandA/p Capacity Traffic Flow Queue Arr.Dep.Arr.Dep.Arr.Dep.Arr.Dep. 1745 – 1800 10 5 13 10 5 0 0 1800 – 1815 13 11 13 11 0 0 1815 – 1830 16 13 3 3 1830 – 1845 7 19 9 17 9 1 5 1845 – 1900 4 13 8 18 5 0 0 TOTAL: 50 64 50 64 4 8 Optimal TFM Strategy # 2, 7/21/00, 1745 - 1900 Total Queue arr. dep. Total Delay (min) arr. dep. Ave. Delay per Flight (min) arr. dep. 4 8 arr. + dep. 12 60 120 180 1.2 1.9 SUMMARY:
 arr. dep. Ave. Delay per Flight (min) arr. dep. 4 8 arr. + dep SUMMARY:.")
13
RSPA/Volpe Center Time Initial DemandA/p Capacity Traffic Flow Queue Arr.Dep.Arr.Dep.Arr.Dep.Arr.Dep. 1745 – 1800 10 5 13 10 5 0 0 1800 – 1815 13 11 13 11 0 0 1815 – 1830 16 13 3 3 1830 – 1845 7 19 8 18 8 2 4 1845 – 1900 4 13 9 17 6 0 0 TOTAL: 50 64 50 64 5 7 Optimal TFM Strategy # 3, 7/21/00, 1745 - 1900 Total Queue arr. dep. Total Delay (min) arr. dep. Ave. Delay per Flight (min) arr. dep. 5 7 arr. + dep. 12 75 105 180 1.5 1.6 SUMMARY:
 arr. dep. Ave. Delay per Flight (min) arr. dep. 5 7 arr. + dep SUMMARY:.")
14
RSPA/Volpe Center Time Initial DemandA/p Capacity Traffic Flow Queue Arr.Dep.Arr.Dep.Arr.Dep.Arr.Dep. 1745 – 1800 10 5 13 10 5 0 0 1800 – 1815 13 11 13 11 0 0 1815 – 1830 16 12 14 12 14 4 2 1830 – 1845 7 19 10 16 10 16 1 5 1845 – 1900 4 13 8 18 5 0 0 TOTAL: 50 64 50 64 5 7 Optimal TFM Strategy # 4, 7/21/00, 1745 - 1900 Total Queue arr. dep. Total Delay (min) arr. dep. Ave. Delay per Flight (min) arr. dep. 5 7 arr. + dep. 12 75 105 180 1.5 1.6 SUMMARY:
 arr. dep. Ave. Delay per Flight (min) arr. dep. 5 7 arr. + dep SUMMARY:.")
15
RSPA/Volpe Center Time Initial Demand A/p Capacity Traffic Flow Queue Arr.Dep.Arr.Dep.Arr.Dep.Arr.Dep. 1745 – 1800 10 5 13 10 5 0 0 1800 – 1815 13 11 13 11 0 0 1815 – 1830 16 11 15 11 15 5 1 1830 – 1845 7 19 10 16 10 16 2 4 1845 – 1900 4 13 9 17 6 0 0 TOTAL: 50 64 50 64 7 5 Optimal TFM Strategy # 5, 7/21/00, 1745 - 1900 Total Queue arr. dep. Total Delay (min) arr. dep. Ave. Delay per Flight (min) arr. dep. 7 5 arr. + dep. 12 105 75 180 2.1 1.2 SUMMARY:
 arr. dep. Ave. Delay per Flight (min) arr. dep. 7 5 arr. + dep SUMMARY:.")
16
RSPA/Volpe Center Time Initial Demand A/p Capacity Traffic Flow Queue Arr.Dep.Arr.Dep.Arr.Dep.Arr.Dep. 1745 – 1800 10 5 13 10 5 0 0 1800 – 1815 13 11 13 11 0 0 1815 – 1830 16 10 16 10 16 6 0 1830 – 1845 7 19 8 18 8 5 1 1845 – 1900 4 13 9 17 9 14 0 0 TOTAL: 50 64 50 64 11 1 Optimal TFM Strategy # 6, 7/21/00, 1745 - 1900 Total Queue arr. dep. Total Delay (min) arr. dep. Ave. Delay per Flight (min) arr. dep. 11 1 arr. + dep. 12 165 15 180 3.3 0.2 SUMMARY:
 arr. dep. Ave. Delay per Flight (min) arr. dep arr. + dep SUMMARY:.")
17
RSPA/Volpe Center Total Queue arr. dep. Total Delay (min) arr. dep. Ave. Delay per Flight (min) arr. dep. 3 10 arr. + dep. 13 45 150 195 0.9 2.3 Non-optimal, Baseline Solution: Total Queue arr. dep. Total Delay (min) arr. dep. Ave. Delay per Flight (min) arr. dep. 3 9 arr. + dep. 12 45 135 180 0.9 2.1 Solution # 1: Total Queue arr. dep. Total Delay (min) arr. dep. Ave. Delay per Flight (min) arr. dep. 4 8 arr. + dep. 12 60 120 180 1.2 1.9 Solution # 2: Total Queue arr. dep. Total Delay (min) arr. dep. Ave. Delay per Flight (min) arr. dep. 5 7 arr. + dep. 12 75 105 180 1.5 1.6 Solution # 3: Total Queue arr. dep. Total Delay (min) arr. dep. Ave. Delay per Flight (min) arr. dep. 7 5 arr. + dep. 12 105 75 180 2.1 1.2 Solution # 5: Summary of Examples, 7/21/00, 1745 - 1900
 arr. dep arr. + dep Non-optimal, Baseline Solution: Total Queue arr. dep. Total Delay (min) arr. dep. Ave. Delay per Flight (min) arr. dep. 3 9 arr. + dep Solution # 1: Total Queue arr. dep. Total Delay (min) arr. dep. Ave. Delay per Flight (min) arr. dep. 4 8 arr. + dep Solution # 2: Total Queue arr. dep. Total Delay (min) arr. dep. Ave. Delay per Flight (min) arr. dep. 5 7 arr. + dep Solution # 3: Total Queue arr. dep. Total Delay (min) arr. dep. Ave. Delay per Flight (min) arr. dep. 7 5 arr. + dep Solution # 5: Summary of Examples, 7/21/00,")
18
RSPA/Volpe Center Time Initial DemandA/p Capacity Traffic Flow Queue Arr.Dep.Arr.Dep.Arr.Dep.Arr.Dep. 1500 – 1515 9 14 13 9 0 1 1515 – 1530 17 13 4 1 1530 – 1545 16 11 16 10 16 10 4 2 1545 – 1600 10 13 12 1 0 1600 – 1615 4 6 13 5 6 0 0 TOTAL: 56 54 56 54 9 4 TFM Strategy Proposed by the STL Specialists, 8/16/00, 1500 - 1615 Total Queue arr. dep. Total Delay (min) arr. dep. Ave. Delay per Flight (min) arr. dep. 9 4 arr. + dep. 13 135 60 195 2.4 1.1 SUMMARY:
 arr. dep. Ave. Delay per Flight (min) arr. dep. 9 4 arr. + dep SUMMARY:.")
19
RSPA/Volpe Center Time Initial DemandA/p Capacity Traffic Flow Queue Arr.Dep.Arr.Dep.Arr.Dep.Arr.Dep. 1500 – 1515 9 14 12 14 9 0 0 1515 – 1530 17 13 4 0 1530 – 1545 16 11 15 11 15 11 5 0 1545 – 1600 10 15 11 15 10 0 0 1600 – 1615 4 6 13 4 6 0 0 TOTAL: 56 54 56 54 9 0 Optimal TFM Strategy, 8/16/00, 1500 - 1615 Total Queue arr. dep. Total Delay (min) arr. dep. Ave. Delay per Flight (min) arr. dep. 9 0 arr. + dep. 9 135 0 135 2.4 0 SUMMARY: Examples of Multiple Optimal TFM Strategies, 8/16/00, 1500 - 1615 (provided 31% reduction in the total arrival plus departure delay)
 arr. dep. Ave. Delay per Flight (min) arr. dep. 9 0 arr. + dep SUMMARY: Examples of Multiple Optimal TFM Strategies, 8/16/00, (provided 31% reduction in the total arrival plus departure delay).")
20
RSPA/Volpe Center Time Initial DemandA/p Capacity Traffic Flow Queue Arr.Dep.Arr.Dep.Arr.Dep.Arr.Dep. 1500 – 1515 9 14 12 14 9 0 0 1515 – 1530 17 13 14 12 14 12 3 1 1530 – 1545 16 11 16 10 16 10 3 2 1545 – 1600 10 13 12 0 0 1600 – 1615 4 6 13 4 6 0 0 TOTAL: 56 54 56 54 6 3 Optimal TFM Strategy, 8/16/00, 1500 - 1615 Total Queue arr. dep. Total Delay (min) arr. dep. Ave. Delay per Flight (min) arr. dep. 6 3 arr. + dep. 9 90 45 135 1.6 0.8 SUMMARY:
 arr. dep. Ave. Delay per Flight (min) arr. dep. 6 3 arr. + dep SUMMARY:.")
21
RSPA/Volpe Center Time Initial DemandA/p Capacity Traffic Flow Queue Arr.Dep.Arr.Dep.Arr.Dep.Arr.Dep. 1500 – 1515 9 14 12 14 9 0 0 1515 – 1530 17 13 15 11 15 11 2 2 1530 – 1545 16 11 15 11 15 11 3 2 1545 – 1600 10 13 12 0 0 1600 – 1615 4 6 13 4 6 0 0 TOTAL: 56 54 56 54 5 4 Optimal TFM Strategy, 8/16/00, 1500 - 1615 Total Queue arr. dep. Total Delay (min) arr. dep. Ave. Delay per Flight (min) arr. dep. 5 4 arr. + dep. 9 75 60 135 1.3 1.1 SUMMARY:
 arr. dep. Ave. Delay per Flight (min) arr. dep. 5 4 arr. + dep SUMMARY:.")
22
RSPA/Volpe Center Time Initial DemandA/p Capacity Traffic Flow Queue Arr.Dep.Arr.Dep.Arr.Dep.Arr.Dep. 1500 – 1515 9 14 12 14 9 0 0 1515 – 1530 17 13 15 11 15 11 2 2 1530 – 1545 16 11 16 10 16 10 2 3 1545 – 1600 10 12 14 12 13 0 0 1600 – 1615 4 6 13 4 6 0 0 TOTAL: 56 54 56 54 4 5 Optimal TFM Strategy, 8/16/00, 1500 - 1615 Total Queue arr. dep. Total Delay (min) arr. dep. Ave. Delay per Flight (min) arr. dep. 4 5 arr. + dep. 9 60 75 135 1.1 1.4 SUMMARY:
 arr. dep. Ave. Delay per Flight (min) arr. dep. 4 5 arr. + dep SUMMARY:.")
23
RSPA/Volpe Center Time Initial DemandA/p Capacity Traffic Flow Queue Arr.Dep.Arr.Dep.Arr.Dep.Arr.Dep. 1500 – 1515 9 14 12 14 9 0 0 1515 – 1530 17 13 17 9 9 0 4 1530 – 1545 16 11 16 10 16 10 0 5 1545 – 1600 10 16 10 15 0 0 1600 – 1615 4 6 13 4 6 0 0 TOTAL: 56 54 56 54 0 9 Optimal TFM Strategy, 8/16/00, 1500 - 1615 Total Queue arr. dep. Total Delay (min) arr. dep. Ave. Delay per Flight (min) arr. dep. 0 9 arr. + dep. 9 0 135 135 0 2.5 SUMMARY:
 arr. dep. Ave. Delay per Flight (min) arr. dep. 0 9 arr. + dep SUMMARY:.")
24
RSPA/Volpe Center Total Queue arr. dep. Total Delay (min) arr. dep. Ave. Delay per Flight (min) arr. dep. 9 4 arr. + dep. 13 135 60 195 2.4 1.1 Total Queue arr. dep. Total Delay (min) arr. dep. Ave. Delay per Flight (min) arr. dep. 0 9 arr. + dep. 9 0 135 135 0 2.5 Total Queue arr. dep. Total Delay (min) arr. dep. Ave. Delay per Flight (min) arr. dep. 4 5 arr. + dep. 9 60 75 135 1.1 1.4 Total Queue arr. dep. Total Delay (min) arr. dep. Ave. Delay per Flight (min) arr. dep. 5 4 arr. + dep. 9 75 60 135 1.3 1.1 Total Queue arr. dep. Total Delay (min) arr. dep. Ave. Delay per Flight (min) arr. dep. 9 0 arr. + dep. 9 135 0 135 2.4 0 Summary of Examples, 8/16/00, 1500 - 1615 Non-optimal, Baseline Solution: Solution # 1: Solution # 2: Solution # 3: Solution # 5:
 arr. dep. 9 4 arr. + dep Total Queue arr. dep. Total Delay (min) arr. dep. Ave. Delay per Flight (min) arr. dep. 0 9 arr. + dep Total Queue arr. dep. Total Delay (min) arr. dep. Ave. Delay per Flight (min) arr. dep. 4 5 arr. + dep Total Queue arr. dep. Total Delay (min) arr. dep. Ave. Delay per Flight (min) arr. dep. 5 4 arr. + dep Total Queue arr. dep. Total Delay (min) arr. dep. Ave. Delay per Flight (min) arr. dep. 9 0 arr. + dep Summary of Examples, 8/16/00, Non-optimal, Baseline Solution: Solution # 1: Solution # 2: Solution # 3: Solution # 5:.")
25
RSPA/Volpe Center Which One of the Multiple Solutions to Select? Collaboration between the FAA and Airlines’ TFM Specialists is Needed to Select the Best Arrival/Departure Strategy that Satisfies both the Operational Resource Providers (FAA) and the Resource Users (Airlines) The Answer is CDM:
 and the Resource Users (Airlines) The Answer is CDM:.")
26
RSPA/Volpe Center

37
Proposed Operational Concept for Using the Arrival/Departure Tradeoff Optimization Tool The Tool is a Decision Support Tool for Strategic, Joint Management of Arrival and Departure Traffic at Airports During the Periods of Traffic Congestion (from 1 to 23 hours into the future). The Tool can be Used Locally by TRACON TFM Specialists to Solve Congestion Problems at a Specific Airport, which is Outside National TFM Programs (e.g., GDP, GS). The Tool can be Used Jointly by Local (TRACON), Regional (ARTCC) and Central (ATCSCC) FAA Facilities’ TFM Specialists to Solve Congestion Problems During National TFM Programs. The Tool Can be Used for Historical Analysis and Review of the Airport Arrival and Departure Operations (up to 11 Hours Back).
. The Tool can be Used Jointly by Local (TRACON), Regional (ARTCC) and Central (ATCSCC) FAA Facilities’ TFM Specialists to Solve Congestion Problems During National TFM Programs. The Tool Can be Used for Historical Analysis and Review of the Airport Arrival and Departure Operations (up to 11 Hours Back)..")
38
RSPA/Volpe Center Proposed Operational Concept (Cont.) 1.For the Specific Time Period, TRACON TFM Specialists (with Collaboration with Airlines where Applicable) Determine the Best Arrival and Departure Strategy for a Predicted Traffic Demand at the Airport Using the Arrival/Departure Tradeoff Tool. The Strategy Includes: Airport Arrival and Departure Capacities (15-minute and Hourly Rates) Number of Arrival and Departure Operations at Each 15-minute Interval Compatible with the Optimal Capacities
 Number of Arrival and Departure Operations at Each 15-minute Interval Compatible with the Optimal Capacities.")
39
RSPA/Volpe Center Proposed Operational Concept (Cont.) 2.The Predicted Airport Arrival and Departure Capacities are Submitted to Regional (ARTCC) and Central (ATCSCC) FAA Facilities for Review and Approval. 3.After the Capacities have been Approved, they are Entered into the National Airspace System (NAS) and Become Available to the Aviation Community and Various NAS Users. 4.The Tool Allows for Periodic Updates of Airport Capacities and TFM Strategies Based on Updated Predictions of Traffic Demand and Weather.
 and Become Available to the Aviation Community and Various NAS Users. 4.The Tool Allows for Periodic Updates of Airport Capacities and TFM Strategies Based on Updated Predictions of Traffic Demand and Weather..")
40
RSPA/Volpe Center Summary of Results 1.A Prototype of Arrival/Departure Tradeoff Optimization Tool was Successfully Tested and Evaluated at the STL TRACON and ATC Tower as a Decision Support Tool for the Optimal, Strategic Management of Arrival and Departure Operations During Peak Periods at Airports. 3.The Results of Numerical Experiments on Data from July and August 2000 have been Jointly Analyzed by the Specialists of STL, TWA and Volpe Center. 4. The Tool-generated, Optimal Arrival/Departure Strategies were Evaluated. The Strategies Appeared to be Equal to or Better than the Strategies Proposed by the STL TFM Specialists (without Using the Tool) in Terms of the Total Delay. With the Tool, the Total Delays were Reduced by 8% to 31%. 2.The Study Confirmed Basic Assumptions that were Used in the Arrival/Departure Capacity Optimization Model.
 in Terms of the Total Delay. With the Tool, the Total Delays were Reduced by 8% to 31%. 2.The Study Confirmed Basic Assumptions that were Used in the Arrival/Departure Capacity Optimization Model..")
41
RSPA/Volpe Center Summary of Results (cont.) 5. The Tool Performed Fast Calculations and Provided Multiple Optimal Strategies when they Existed. This Opens New Opportunities for the FAA and Airlines’ TFM Specialist in the Collaborative Decision Making. 6.All Participants of the Study Found the Tool to be an Efficient Decision Support Tool for Strategic TFM. 8.The Tool’s Functions and GUI were Enhanced due to Feedback from STL and Airline’s TFM Specialists. 7.Participants of the Study Proposed an Operational Concept for Using the Tool.

Similar presentations


 Towers ARTCC ARTCC(s) Towers Airports Industry AOC(s) GA International.>")


: Wx Integration Ray Moy New Weather Concept Development Branch FAA, Aviation Weather Division, ANG-C62.>")

.ppt 1030 Federal Aviation Administration Presentation of System Airport.>")