Download presentation
Presentation is loading. Please wait.

1
CWA AquaEnviro Conference (18-19 September 2012) An investigation in the hydraulic and treatment performance of vegetated SuDS Alexandros Tsavdaris (PhD student) e-mail:alexandros.tsavdaris@port.ac.uk Georgios Roinas (PhD student) e-mail:georgios.roinas@port.ac.uk School of Civil Engineering and Surveying Project Supervisors: Dr. John Williams john.williams@port.ac.ukjohn.williams@port.ac.uk Dr. Steve Mitchell steve.mitchell@port.ac.uksteve.mitchell@port.ac.uk Dr. Catherine Mant catherine.mant@port.ac.uk

2
Wetlands at Portsmouth Gravel Bed Hydroponics 1980’s-1990’s ▫UK; Egypt ▫Colombia; Greece Phytoremediation with reeds ▫Oil Pollution ▫MoD Road Runoff ▫A34 Newbury Bypass – 1995- 2000 ▫Newlands MDA 2005-2010

4
Current Work in Vegetated Systems 2 Projects ▫Hydraulics and Sedimentation in vegetated SuDs ▫Fate of hydrocarbons (TPH, PAHs) in SuDs – particularly source control vs non-source control. Local case study intensively studied and additional sites used for comparison. ▫Local Roads ▫Trunk Roads ▫Housing Development

5
CASE STUDY 1: LOCAL ROAD Newlands MDA, Waterlooville, Hampshire Major Development, 2000+ new dwellings on greenfields – Grainger PLC SuDs designed by Mayer Brown Ltd KTP UoP intended to study SuDs in construction – but focused on an access road pond due to project delays

6
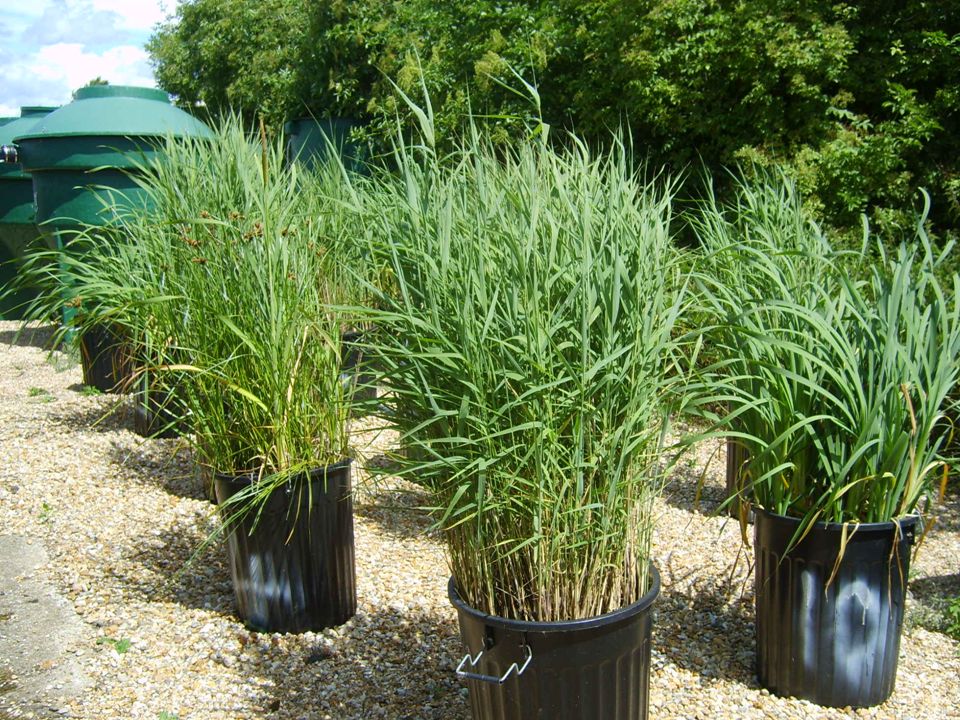
Access Road Swale and Vegetated Pond

7
Swale Vegetated Basin

8
Site Description Permanent water depth of 1m (rising to 1.60 m) Storage capacity 306 m 3 Receives road-runoff from an adjacent to road swale. Treated water ↔ River Wallington ↔ The use of tracers is prohibited. Sediment Traps (ST) ↔ monitoring purposes Auto-Samplers at inlet/outlet ↔ storm analysis
 ↔ monitoring purposes Auto-Samplers at inlet/outlet ↔ storm analysis.")
9
Monitoring Water Quality in Basins and River ▫Normal conditions ▫Storm Flow ▫BOD, COD, TSS, VSS, Amm-N, Conductivity, metals, TPH, PAHs Sediment and soils ▫Sediment Catch Traps – quantity, metals, PSD ▫Soils – TPH, PAHs Flows and Vegetation

10
Water Quality in the System Low values of Ammonium and Ec compared to the River. Decrease from B1 to B2 suggests good treatment performance regarding the specific water quality indicators. [n=11]

11
[n=15] Within the basins 50%-60% of settling solids are volatile, much higher than sediment at the Inlet/Outlet, indicating decaying vegetation or other organics within the system. B2 seems to have more volatile substances than B1. [n=15] Significantly more settling solids were found in B1 compared to B2 with similar proportion of coarse (>63um) and fine (<63um) particles. B1 B2 B1 OutletInlet Settling Solids-Sediments [n=15] TSS, mg/l VSS, mg/l
![[n=15] Within the basins 50%-60% of settling solids are volatile, much higher than sediment at the Inlet/Outlet, indicating decaying vegetation or other organics within the system.](http://images.slideplayer.com/38/10763135/slides/slide_11.jpg "B2 seems to have more volatile substances than B1. [n=15] Significantly more settling solids were found in B1 compared to B2 with similar proportion of coarse (>63um) and fine (<63um) particles. B1 B2 B1 OutletInlet Settling Solids-Sediments [n=15] TSS, mg/l VSS, mg/l.")
12
Particle Size Distribution Inlet sediment ↔ Coarser particles than Outlet sediment. Coarse particles ↔ Easily constrained by vegetated systems. Finer particles ↔ Difficult to control (Zanders, 2004) Settling solids range from 5 to 80 µm with no significant differences between d(0.5) across the system. Settling Solids B1 B2
 Settling solids range from 5 to 80 µm with no significant differences between d(0.5) across the system. Settling Solids B1 B2.")
13
Water Quality- Storm Events

14
Waterlooville Site

16
Heavy metals are found both in the particulate and soluble fractions Indication that the River is more polluted than the pond system. Concentrations of HM in water vary with season with the lowest values during the summer. Heavy Metals in Water

17
PGE are associated with catalytic converters and auto-mobile activity. Pd and Rh have strong correlation both in settling solids and water samples Generally, Pd conc. much higher than Rh conc., as observed by Whiteley and Murray (2003), no significant difference between particulate and soluble fractions. Platinum Group Elements Settling SolidsWater
, no significant difference between particulate and soluble fractions. Platinum Group Elements Settling SolidsWater.")
18
Since construction began there has been a significant increase in the SCOD and Ca in runoff. Impact of construction on SuDS requires further research. Impacts of Construction

19
CASE STUDY 2 – TRUNK ROADS Two Sites ▫ A34 Newbury Bypass ▫ M27 Itchen Branch Both vegetated ponds Allows higher loadings to be compared and different pond shapes A34 Source Control –M27 Concrete Road + no-source control

20
A34 Newbury Bypass – Ponds B and C Various configurations and planting Source Control: Porous asphalt, oil interceptors and sediment traps

21
A34 Newbury Bypass – Ponds B and C

22
M27 Itchen Branch Motorway runoff No-source control Rectangular layout

23
M27 Itchen Branch

24
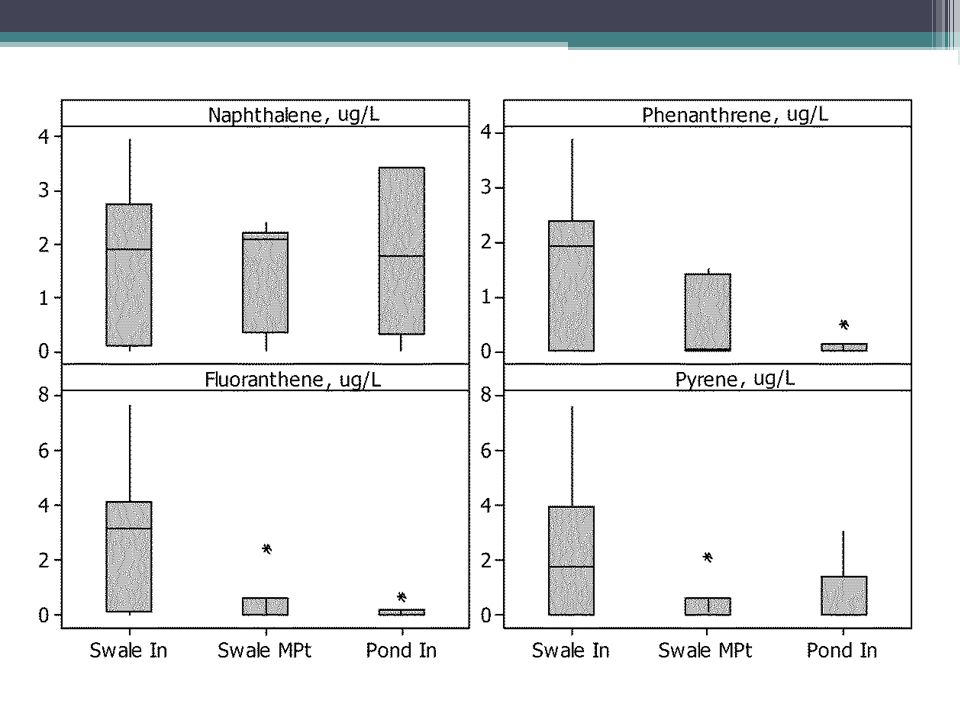
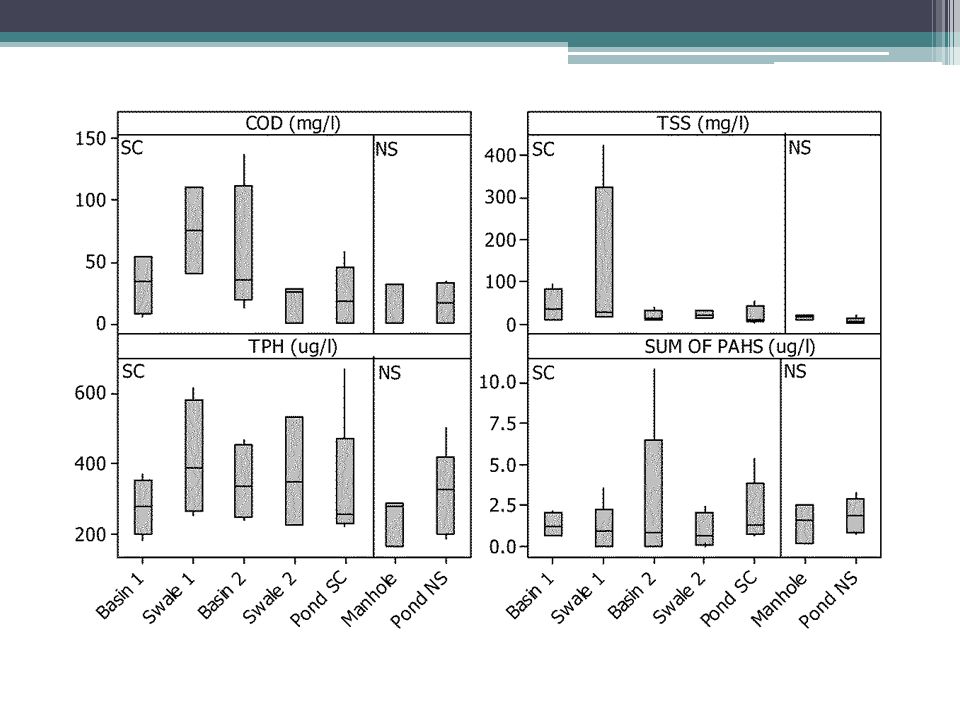
TPH in Trunk Road Runoff by Season

25
CASE STUDY 3 – RESIDENTIAL DEVELOPMENT Cambourne, Cambridgeshire Steve Wilson (EPG ltd) - EU Demonstrative site (map from CIRIA)
 - EU Demonstrative site (map from CIRIA)")
26
Cambourne Swales and basins in series serving a housing development Also allows a comparison with a neighbouring catchment with no SuDs

27
S2

29
CFD Model Development Newlands pond used for the development of a CFD model with ANSYS 12.1 Fluent Software Field monitoring and lab studies used to model of flow through reeds, will be combined with sedimentation and PSD data Allow CFD models of different pond morphologies and planting to be investigated to investigate sedimentation and pollutant removal. Most vegetated SF wetland models have incorporated porous zones to account for impact of aquatic vegetation. Emergent vegetation poses different problem as the stems act in a different manner.

30
LABORATORY STUDY Flow around individual stems investigated in a hydraulics flume (L=4m, b=0.3m) Site survey data showed two different vegetation densities in the shallow, and deep zones within the pond The Flume was run with no vegetation and with simulations of the shallow and deep vegetation densities under two different inflows. Velocity fields measured with a Valeport 810 electromagnetic current meter. CFD model of flume with no vegetation, individual stems and porous zones compared.

31
Good agreement between experimental and CFD results for no vegetation and individual stem configurations Porous zone model under-predicted the velocity field in the vegetated zone (also observed by Li and Zeng, 2009), but did predict the increase/decrease of velocity seen before and after the vegetation. No Veg. VD-Deep-Porous VD-Deep-IS Vegetated region Flume

32
Flow scenario 1: Max Inflow (35 l/s) Max water level (1.5 m) ▫ So far porous zone model of pond produced. Stem model not appropriate large scale. ▫ The non vegetated pond has generally lower velocities in the basins ▫ Vegetation enables preferential flow paths and circular motion within the pond as well as velocity increase in the shallow zones. Also observed by Saggiori, S. (2010) ▫ However, vegetation reduces the velocity downstream of B1 as also observed in the flume experiment. Pond-CFD No Vegetation Vegetation – Porous Zone
 ▫ However, vegetation reduces the velocity downstream of B1 as also observed in the flume experiment. Pond-CFD No Vegetation Vegetation – Porous Zone.")
33
Conclusions Road runoff is a highly variable influent. Site specific and seasonal variation; first flush during storm events highly significant. Wetland systems have shown good removals of pollutants. But dynamic nature means that this is not always progressive. Initial CFD model has been created for flow in SF wetlands and ponds. Will be refined and improved to assess pollutant removal in different pond shapes and planting.

Similar presentations
>")


 WP2 – INTEGRATED CATCHMENT SIMULATOR.>")


 Research Team Dr. Steve Wallis & Catherine Morgan (PhD student) (Heriot Watt University) Dr. Kate Heal & Alan Jones (PhD student)>")


