Download presentation
Presentation is loading. Please wait.

1
Lloydminster 2015 Municipal Census

2
Population The City of Lloydminster experienced a minor decline in population (0.34%) over the past two years, dropping from 31,483 to 31,377. This is the first municipal census since 2001 that the City has experienced a decline in population. Lloydminster 2015 Municipal Census Census Year PopulationGrowth/DeclinePercentage Time Period SKAB 200624,0283,04012.65%58,11815,910 200926,5012,4739.33%39,10017,401 201127,8041,3034.70%29,77218,032 201331,4833,67911.68%211,43420,052 201531,377-106-0.34%211,63819,740

3
Historical Population Growth (Municipal Census) Lloydminster 2015 Municipal Census
 Lloydminster 2015 Municipal Census")
4
Demographics 27.56% of Lloydminster’s population is between the ages of 20-34 21.32% of the population is between the ages of 35-49 20.17% of the population is between 5-19 The age category with the greatest population was ages 25-29, with 2,740 Lloydminster 2015 Municipal Census Age0-45-910-1415-1617-1920-2425-2930-3435-3940-4445-4950-5455-5960-6465-6970-7475+ Total 27,377* 2015 total 2063207517546481042219327092641227019201644177714051094733503906 * Note: In 2015, 4,000 residents chose not to provide their age information

5
Changes from 2013 Municipal Census Lloydminster 2015 Municipal Census Age Bracket 2013 Total 2015 Total Change Age Bracket 2013 Total 2015 Total Change 0-42,5202,063-45735-392,2352,270+34 5-92,1152,075-4040-442,0001,920-80 10-142,0501,754-13245-492,1151,644-471 15-16780648-13250-542,0451,777-268 17-191,2701,042-22855-591,5201,405-115 20-242,7102,193-51760-641,1601,094-66 25-292,9902,709-28165-69730733+3 30-342,5552,641+8670-74575205-370 75+1,425906-519

6
Lloydminster 2015 Municipal Census 2015 Age Breakdown

7
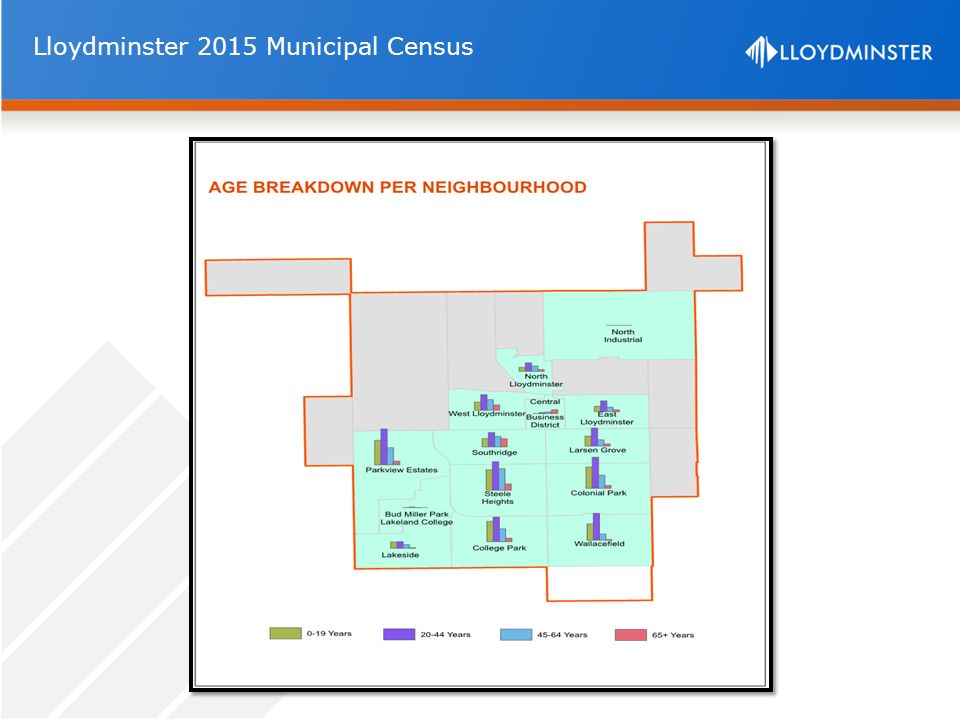
Neighbourhoods Lloydminster’s most populated neighbourhoods are Parkview Estates at 14.5%, Steele Heights at 13.9%, and Colonial Park at 12.9% of the total population. Since 2013, the neighbourhood with the largest population increase was Larsen Grove with a 971 (74.9%) increase in population, followed by Parkview Estates with a 627 (15.9%) increase in population. Lloydminster 2015 Municipal Census
 increase in population, followed by Parkview Estates with a 627 (15.9%) increase in population. Lloydminster 2015 Municipal Census.")
9
Population by Neighbourhood* Neighbourhood 2013 Population 2015 Population Change 2013-2015 Neighbourhood 2013 Population 2015 Population Change 2013-2015 Central Business District 757411-346North East Area242 College Park3,5643,771207 Parkview Estates 3,9324,559627 Colonial Park4,2604,069-191Southridge2,8482,510-338 East Lloydminster 1,5091,477-32Steele Heights5,1364,376-760 Lakeside8421,067169Wallacefield3,5763,319-257 Larsen Grove1,2962,267971 West Lloydminster 2,3162,33115 North Lloydminster 1,4451,177-268Total31,48131,338*-106 *Note: 39 residents have been marked under “New Address” category and are not shown in the above chart results.

10
Housing The percentage of residents that own a home in the City is 60.5%. 26.1% of residents rent their homes. Lloydminster 2015 Municipal Census Length of Residency*TotalPercent Less than 2 years4,51916.41% 2 - 4 years5,18418.83% 5 - 9 years5,31319.29% 10+ years12,51445.46% T OTAL 27,530 *Note: 3,847 residents chose not to provide their length of residency

11
Residency Prior to Lloydminster Lloydminster 2015 Municipal Census *Note: 4,557 residents chose not to provide their prior residency Prior Residency*Totals Atlantic Canada (ON, QC, NB, NS, PE, NL)738 Central Provinces (MB, SK)893 Western Provinces (AB, BC)1,362 Relocated from outside of Canada816
738 Central Provinces (MB, SK)893 Western Provinces (AB, BC)1,362 Relocated from outside of Canada816")
12
Census Methodology Lloydminster 2015 Municipal Census A census letter with instructions and a unique Personal Identification Number (PIN) was delivered to each residence in Lloydminster beginning Wednesday, April 1, 2105. Residents used their PIN to complete the census online prior to the enumerators coming door-to- door. The census areas were broken down by tax grid. Legislative Services was able to collect data from 99% of the households – which included online responses, door-to-door canvasing, neighbour responses, and phone-in responses. 40% of households complete the census online, an increase of 3% over the 2013 census. The census ended on Friday, June 12, 2015.

13
Thank you for reading! www.lloydminster.ca

Similar presentations


.>")


