Download presentation
Presentation is loading. Please wait.

1
pH Titration Curves & Indicators

2
Objectives 1)Review AS understanding of titration calculations for: Reacting volumes & Reactant concentrations 1)Predict, draw and explain titration curves 2)Explain what an indicator is Describe the characteristics of indicators Use pH curves to select an appropriate indicator
Review AS understanding of titration calculations for: Reacting volumes & Reactant concentrations 1)Predict, draw and explain titration curves 2)Explain what an indicator is Describe the characteristics of indicators Use pH curves to select an appropriate indicator")
3
25.0cm 3 of 0.14M NaOH are exactly neutralised by a solution of 0.2M HCl. What was the volume of HCl? cm 3

4
25.0cm 3 of ethanedioic acid, H 2 C 2 O 4, is neutralised by 28.6 cm 3 of a 0.28 moldm -3 solution of sodium hydroxide, NaOH. Calculate the concentration of ethanedioic acid solution. 0.16 moldm -3

5
The change in pH during acid-base titrations can be used to determine the equivalence point. A graph of pH of the solution being titrated plotted against volume of solution added gives a pH curve. “the point at which stoichiometrically equivalent amounts of acid and base have been reacted”

6
25 cm 3 of 0.100 moldm -3 HCl titrated against 0.100 moldm -3 NaOH

7
starting pH ending pH x equivalence point 25 cm 3 of 0.100 moldm -3 HCl titrated against 0.100 moldm -3 NaOH

8
Strong acid (HCl) : Strong base (NaOH) equivalence point = 7 Strong acids react with strong bases to form neutral solutions Major ions present are Na+ and Cl- ions which have no effect pH
 : Strong base (NaOH) equivalence point = 7 Strong acids react with strong bases to form neutral solutions Major ions present are Na+ and Cl- ions which have no effect pH")
9
(a)(b) (c) Identify each of the following as: 1)weak acid – weak base 2)weak acid – strong base 3)strong acid – weak base
(b) (c) Identify each of the following as: 1)weak acid – weak base 2)weak acid – strong base 3)strong acid – weak base")
10
Strong acid (HCl) : Weak base (NH 3 ) starting pH ending pH x equivalence point
 : Weak base (NH 3 ) starting pH ending pH x equivalence point")
11
Strong acid (HCl) : Weak base (NH 3 ) equivalence point < 7 NH 4 + ions are present which act as Bronsted-Lowry acid Write the equation for the reaction
 : Weak base (NH 3 ) equivalence point < 7 NH 4 + ions are present which act as Bronsted-Lowry acid Write the equation for the reaction")
12
Weak acid (CH 3 COOH) : Strong base (NaOH) starting pH ending pH x equivalence point
 : Strong base (NaOH) starting pH ending pH x equivalence point")
13
Weak acid (CH 3 COOH) : Strong base (NaOH) equivalence point > 7 CH 3 COO - ions are present which act as Bronsted-Lowry base Write the equation for the reaction
 : Strong base (NaOH) equivalence point > 7 CH 3 COO - ions are present which act as Bronsted-Lowry base Write the equation for the reaction")
14
Weak acid (CH 3 COOH) : Weak base (NH 3 ) starting pH ending pH x equivalence point
 : Weak base (NH 3 ) starting pH ending pH x equivalence point")
15
equivalence point ~ 7 Weak acid (CH 3 COOH) : Weak base (NH 3 ) Difficult to detect as pH changes gradually and there are no sudden changes
 : Weak base (NH 3 ) Difficult to detect as pH changes gradually and there are no sudden changes")
16
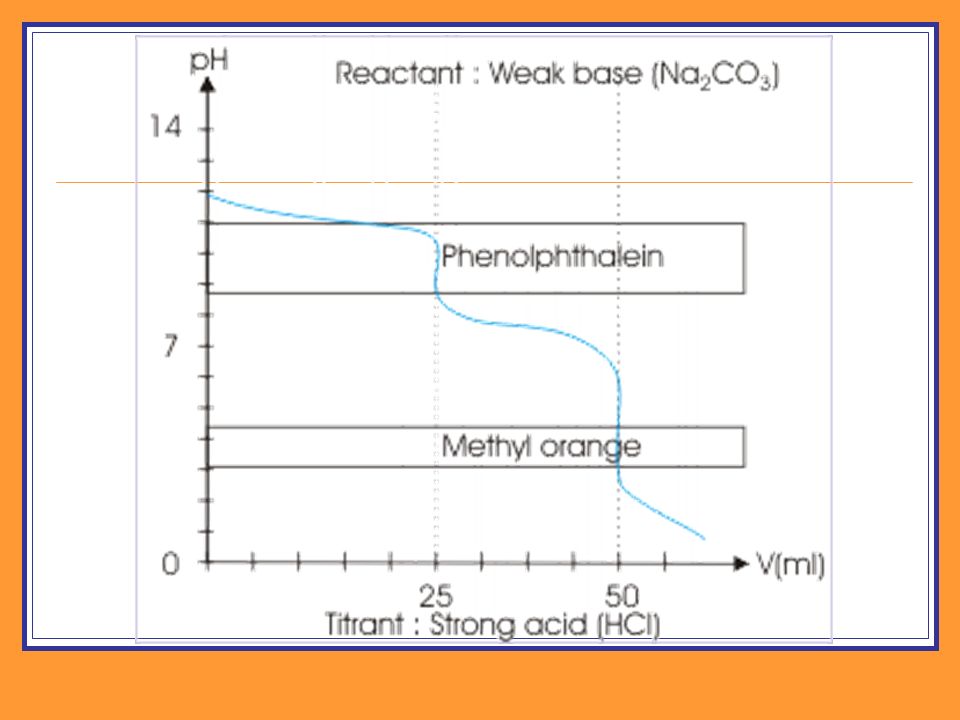
Can you explain what titration this pH curve is representing?

20
Shapes of pH curves – main features System pH at start pH at equivalence pH at twice equivalence strong acid + strong base weak acid + strong base strong base + strong acid weak base + strong acid weak base + weak acid

21
Shapes of pH curves – main features System pH at start pH at equivalence pH at twice equivalence strong acid + strong base 1.07.012.5 weak acid + strong base strong base + strong acid weak base + strong acid weak base + weak acid

22
Shapes of pH curves – main features System pH at start pH at equivalence pH at twice equivalence strong acid + strong base weak acid + strong base > 1.0> 7.012.5 strong base + strong acid weak base + strong acid weak base + weak acid

23
Shapes of pH curves – main features System pH at start pH at equivalence pH at twice equivalence strong acid + strong base weak acid + strong base strong base + strong acid 13.07.01.5 weak base + strong acid weak base + weak acid

24
Shapes of pH curves – main features System pH at start pH at equivalence pH at twice equivalence strong acid + strong base weak acid + strong base strong base + strong acid weak base + strong acid < 13.0< 7.01.5 weak base + weak acid

25
Shapes of pH curves – main features System pH at start pH at equivalence pH at twice equivalence strong acid + strong base weak acid + strong base strong base + strong acid weak base + strong acid weak base + weak acid < 13.0~ 7

27
Acid-Base Indicator “A weak water-soluble organic acid whose acid form (HIn) and co-base (In - ) are different colours.” HIn H + + In - colour 1 colour 2
 and co-base (In - ) are different colours. HIn H + + In - colour 1 colour 2")
28
Common IndicatorsCommon Indicators IndicatorColour 1 acid (HIn) pH rangeColour 2 base (In - ) thymol bluered1.2 - 2.8yellow methyl orangered3.2 – 4.4yellow methyl redred4.8 – 6.0yellow litmusred5.0 – 8.0blue bromothymol blueyellow6.0 – 7.6blue phenol redyellow6.6 – 8.0red phenolphthaleincolourless8.2 – 10.0pink alizarin yellowyellow10.1 – 12.0red
 pH rangeColour 2 base (In - ) thymol bluered yellow methyl orangered3.2 – 4.4yellow methyl redred4.8 – 6.0yellow litmusred5.0 – 8.0blue bromothymol blueyellow6.0 – 7.6blue phenol redyellow6.6 – 8.0red phenolphthaleincolourless8.2 – 10.0pink alizarin yellowyellow10.1 – 12.0red")
29
The end-point This is when a sufficient volume of titrant has been added to give a [H + ] where [HIn] = [In - ]. The equivalence volume of titrant can be found precisely when the indicator has an end point = equivalence point of the titration. The end-point (refers to the indicator) should NOT be called the equivalence point (refers to the titration)
![The end-point This is when a sufficient volume of titrant has been added to give a [H + ] where [HIn] = [In - ].](http://images.slideplayer.com/37/10735338/slides/slide_29.jpg "The equivalence volume of titrant can be found precisely when the indicator has an end point = equivalence point of the titration. The end-point (refers to the indicator) should NOT be called the equivalence point (refers to the titration).")
30
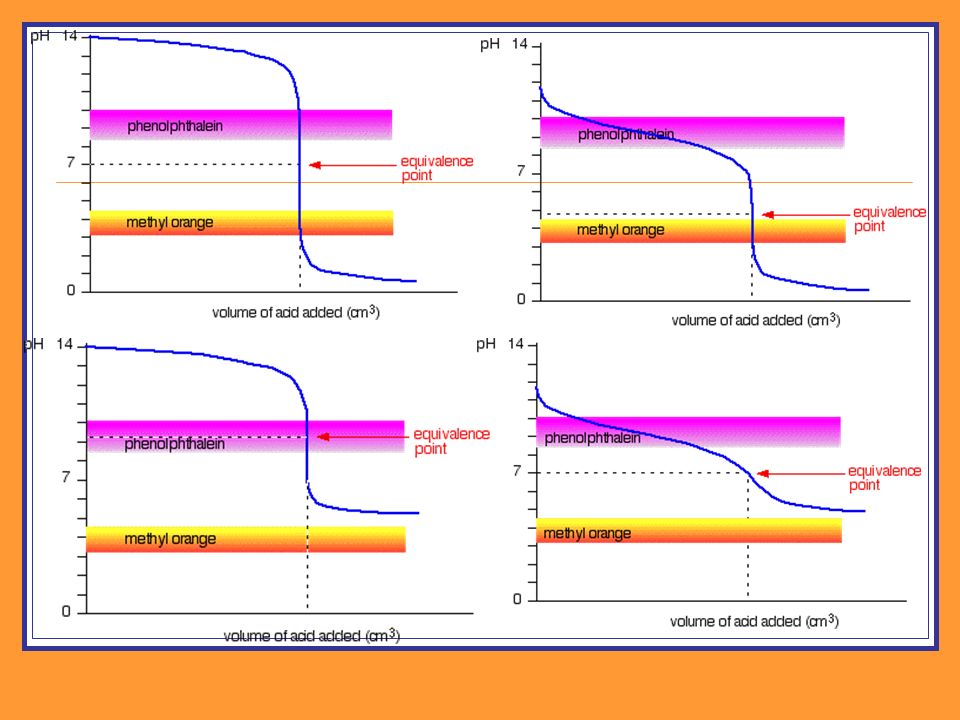
Choosing Indicators The indicator is chosen by considering the specific pH curve for the titration. An indicator is appropriate if the rapid change of pH at equivalence overlaps the activity range of the indicator.

Similar presentations


 Green & Damji Chapter 8, Sections 18.3 & 18.4 Chang Chapter 16 Copyright © The McGraw-Hill Companies, Inc.>")


 Strong acid with strong base. 2) Strong.>")


 H + (aq) +In - (aq)>")