Download presentation
Presentation is loading. Please wait.

1
Add presenter name Date Event/location Countdown to 2015: Liberia

2
Notes for the presenter on adapting this presentation Personalise with photos, charts Data presented are based on best available data up to mid-2012. When presenting, mention more recent studies or data. (2010 mortality on slide #18 added) Select which slides are appropriate for the audience. For example: Slides are provided for each figure presented in the country profile; select from these (choosing all or a few depending on needs) When adapting this for a country or sub-national Countdown process add sub-national level data Review the Speaker Notes, adapt according to your audience and purpose
 Select which slides are appropriate for the audience. For example: Slides are provided for each figure presented in the country profile; select from these (choosing all or a few depending on needs) When adapting this for a country or sub-national Countdown process add sub-national level data Review the Speaker Notes, adapt according to your audience and purpose.")
3
Purpose of this presentation To stimulate discussion about Liberia country data, especially about progress, where we lag behind, and where there are opportunities to scale up To provide some background about Countdown to 2015 for MNCH, the indicators, and data sources in the country profiles To show examples of tools for monitoring progress, sharing information and improving accountability

4
Outline 1.Countdown to 2015: Background 2.Liberia Countdown profile 3.Country Countdown process

5
Part I Countdown to 2015: Background

6
What is Countdown? A global movement initiated in 2003 that tracks progress in maternal, newborn & child health in the 75 highest burden countries to promote action and accountability

7
Countdown origins 2003 Lancet Child Survival Series A refrain from the United Nations, NGOs, and civil society: Effective interventions are available Coverage is unacceptably low and inequitable We need to MAKE NOISE 2005 Lancet Neonatal Series

8
To disseminate the best and most recent information on country-level progress To take stock of progress and propose new actions To hold governments, partners and donors accountable wherever progress is lacking Countdown aims

9
What does Countdown do? Analyze country-level coverage and trends for interventions proven to reduce maternal, newborn and child mortality Track indicators for determinants of coverage (policies and health system strength; financial flows; equity) Identify knowledge and data gaps across the RMNCH continuum of care Conduct research and analysis Support country-level Countdowns Produce materials, organize global conferences and develop web site to share findings 9
 Identify knowledge and data gaps across the RMNCH continuum of care Conduct research and analysis Support country-level Countdowns Produce materials, organize global conferences and develop web site to share findings 9.")
10
Countdown: Promoting accountability for action Country profiles Analysis & events Evidence-based planning, budgeting & programs National Level Global Level

11
75 countries that together account for > 95% of maternal and child deaths worldwide

12
Who is Countdown? Individuals: scientists/academics, policymakers, public health workers, communications experts, teachers… Governments: RMNCH policymakers, members of Parliament… Organizations: NGOs, UN agencies, health care professional associations, donors, medical journals… 12

13
Countdown moving forward Four streams of work to promote accountability, 2011-2015 Responsive to global accountability frameworks -Annual reporting on 11 indicators for the Commission on Information and Accountability for Women’s and Children’s Health (COIA) -Contribute to follow-up of A Promise Renewed/Call to Action Production of country profiles/report and global event(s) Cross-cutting analyses Country-level engagement
 -Contribute to follow-up of A Promise Renewed/Call to Action Production of country profiles/report and global event(s) Cross-cutting analyses Country-level engagement")
14
Part 2 Liberia Countdown country profile Main findings

16
What does Countdown monitor? Progress in coverage for critical interventions across reproductive, maternal, newborn & child health continuum of care Health Systems and Policies – important context for assessing coverage gains Financial flows to reproductive, maternal, newborn and child health Equity in intervention coverage Range of data on the profile

17
The national-level profile uses data from global databases: Population-based household surveys UNICEF-supported MICS USAID-supported DHS Other national-level household surveys (MIS, RHS and others) Provide disaggregated data - by household wealth, urban- rural residence, gender, educational attainment and geographic location Interagency adjusted estimates U5MR, MMR, immunization, water/sanitation Other data sources (e.g. administrative data, country reports on policy and systems indicators, country health accounts, and global reporting on external resource flows etc.) Sources of data
 Sources of data.")
18
Mortality Mortality data through 2010: 2011 child mortality data was released in late 2012: Under-five mortality rate (U5MR)= 78 deaths per 1000 live births Infant mortality rate (IMR) = 58 deaths per 1000 live births Neonatal mortality rate (NMR) = 27 deaths per 1000 live births
= 78 deaths per 1000 live births Infant mortality rate (IMR) = 58 deaths per 1000 live births Neonatal mortality rate (NMR) = 27 deaths per 1000 live births")
19
Leading direct causes: Haemorrhage – 34% Hypertension – 19% Sepsis – 9% Unsafe abortion – 9% Understanding the cause of death distribution is important for program development and monitoring Cause of death

20
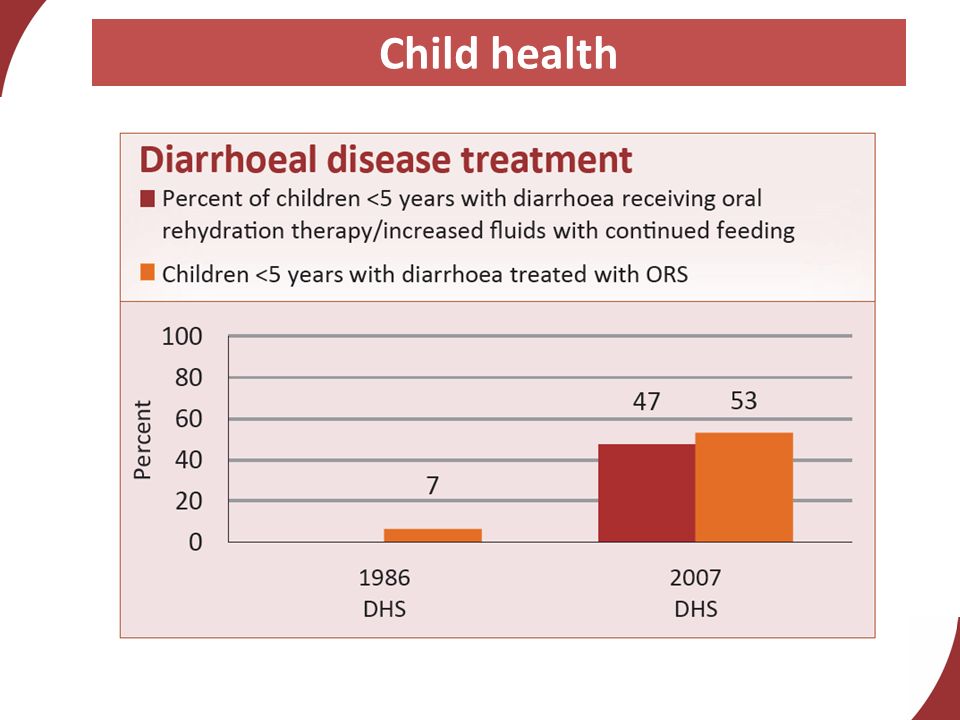
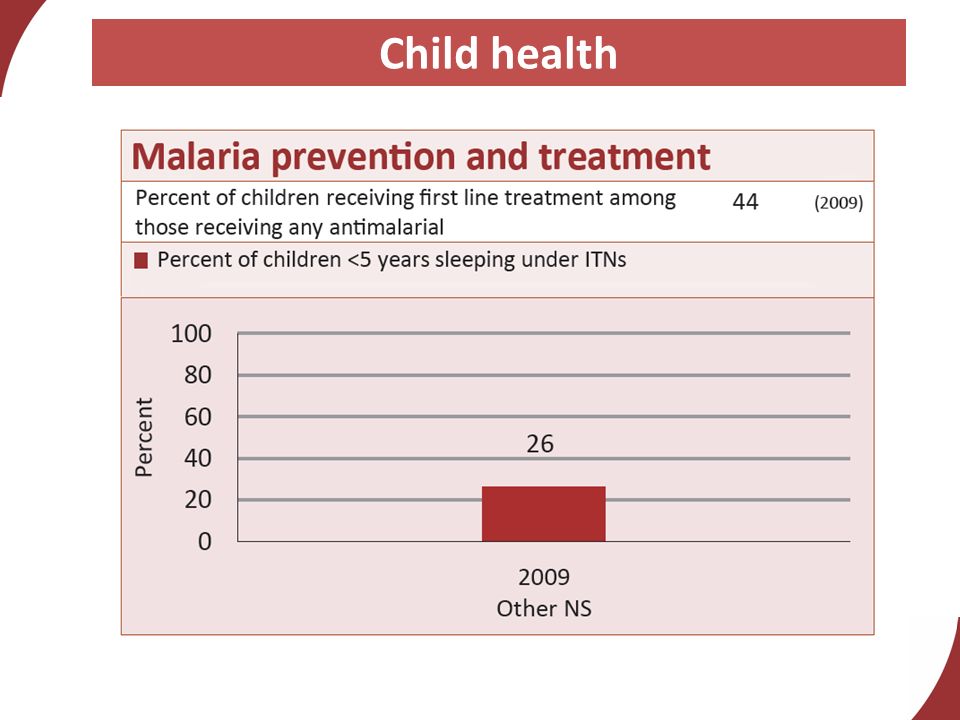
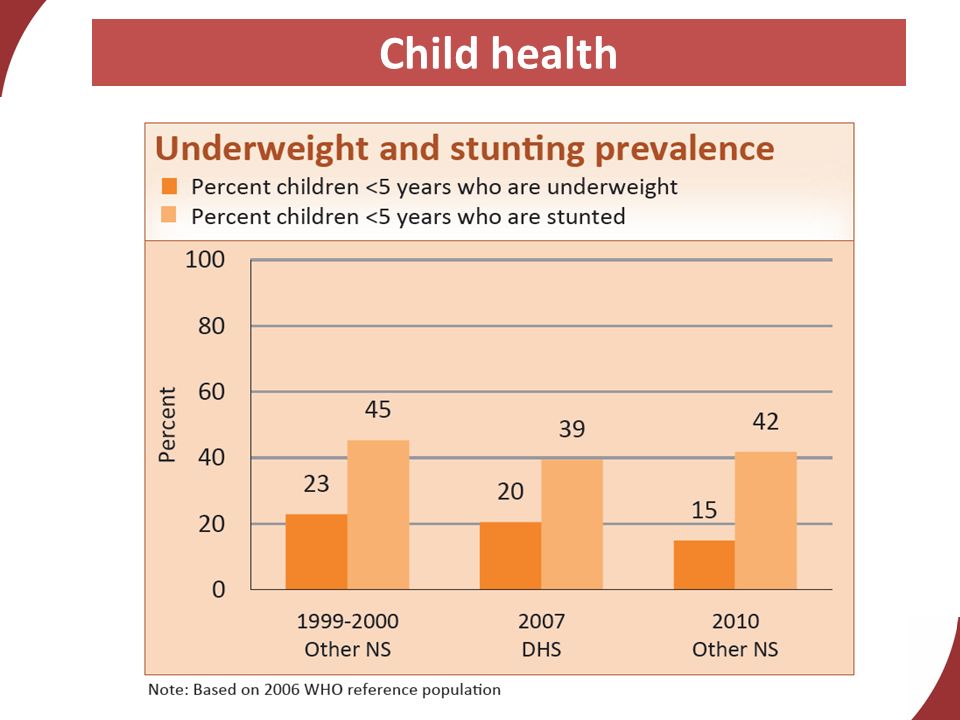
Leading causes: Neonatal – 31% Malaria – 18% Pneumonia – 12% Measles – 10% Diarrhoea – 8% Undernutrition is a major underlying cause of child deaths Cause of death

21
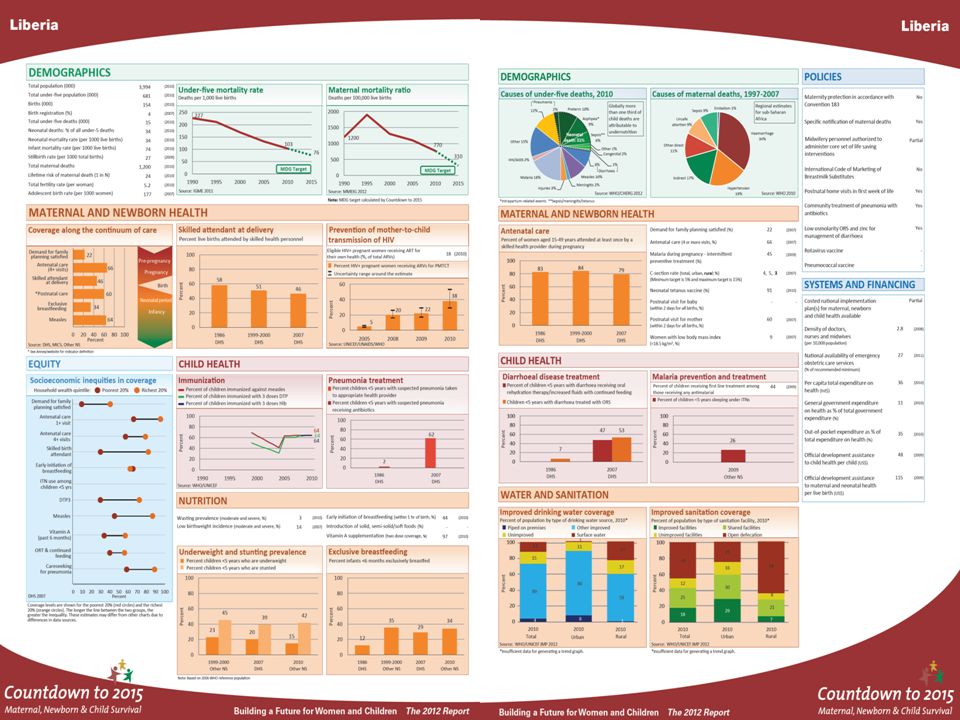
Countdown to 2015 Report. 2012. Demographics

22
Variable coverage along the continuum of care

23
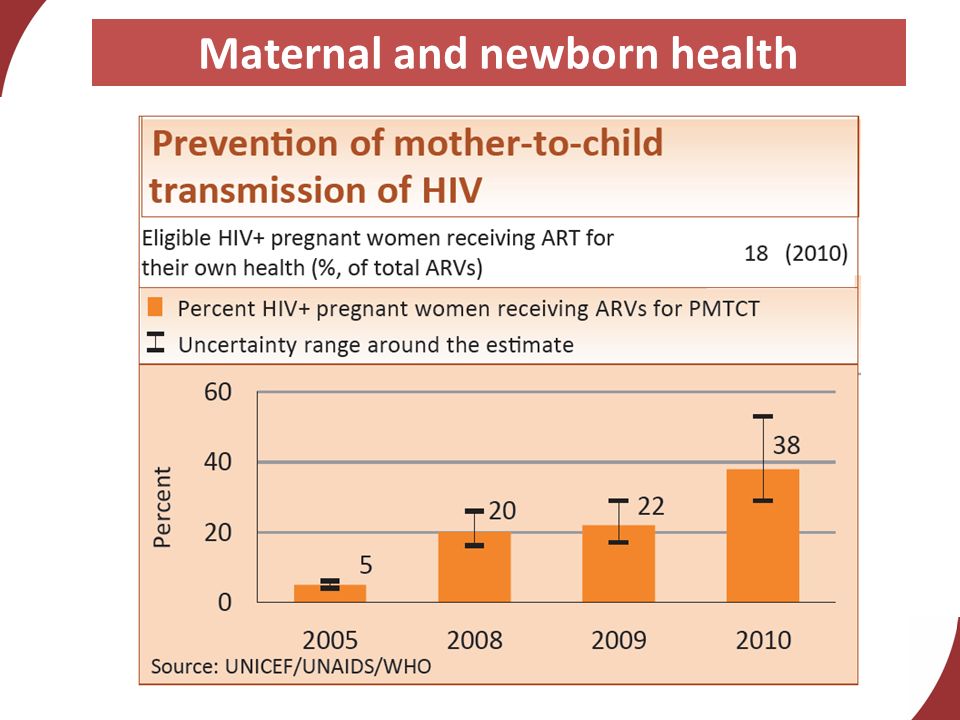
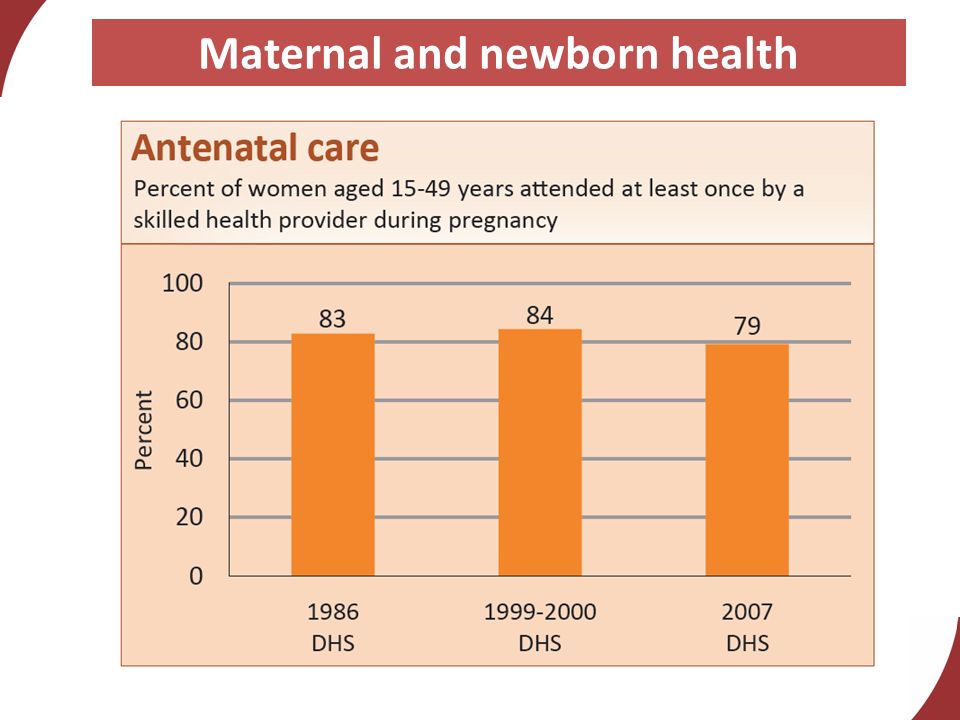
Maternal and newborn health

26
Countdown to 2015 Report. 2012. Other maternal and newborn health indicators

27
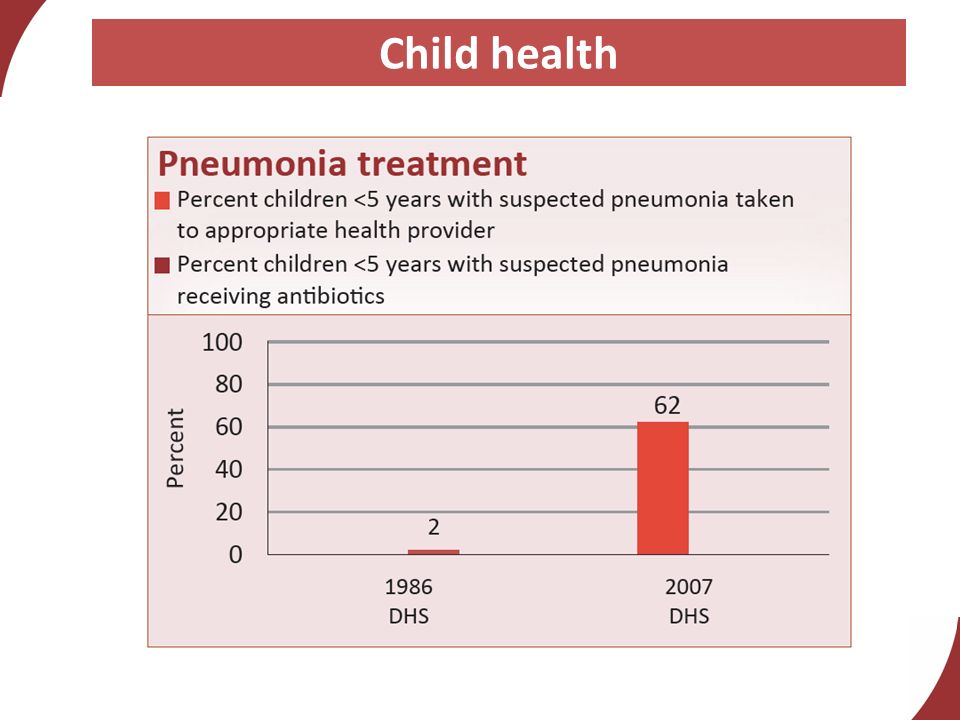
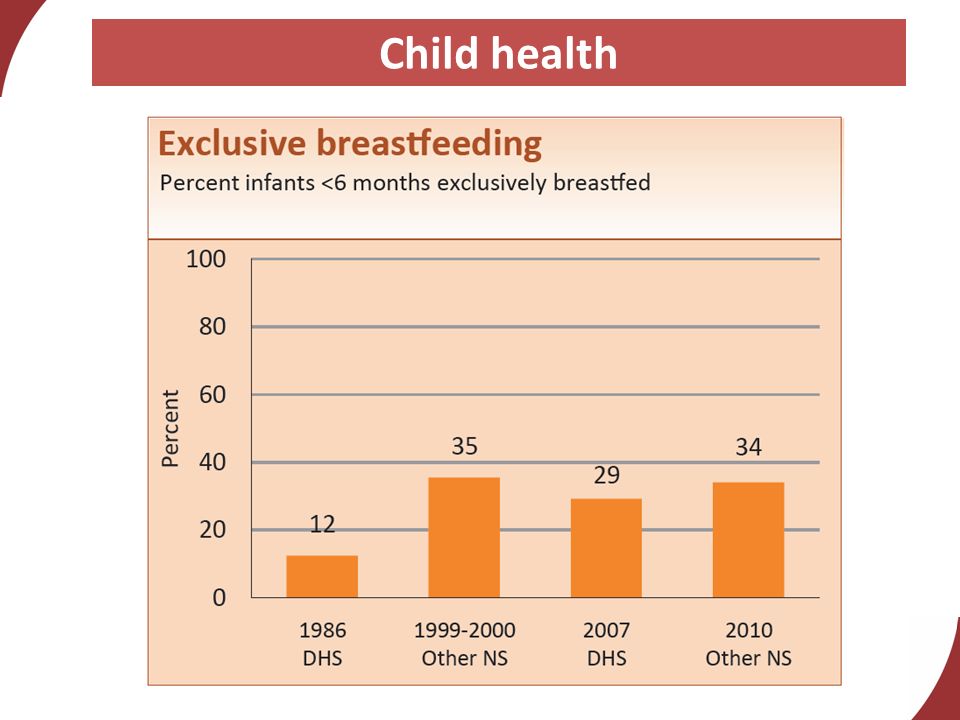
Child health

33
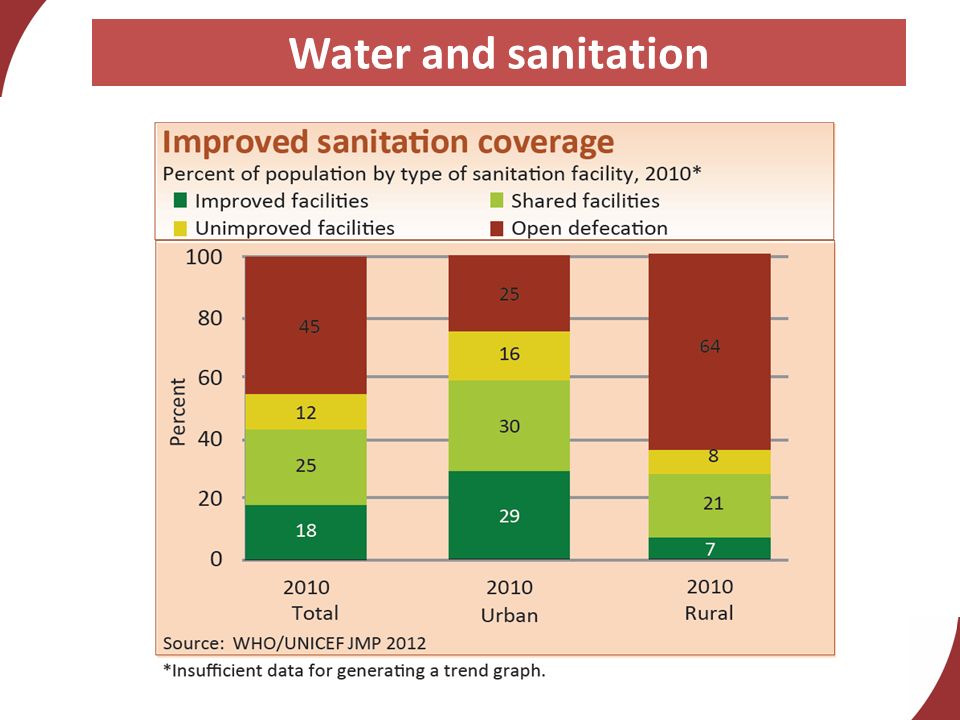
Water and sanitation

35
MNCH policies NO - Maternity protection in accordance with Convention 183 YES - Specific notifications of maternal deaths PARTIAL - Midwifery personnel authorized to administer core set of life saving interventions NO - International Code of Marketing of Breastmilk Substitutes YES - Postnatal home visits in first week of life YES - Community treatment of pneumonia with antibiotics YES - Low osmolarity ORS and zinc for diarrhoea management - Rotavirus vaccine - Pneumococcal vaccine

36
Costed national implementation plans for MNCH: Partial Density of doctors, nurses and midwives (per 10,000 population): 2.8 (2008) National availability of EmOC services: 27% (2011) (% of recommended minimum) Per capita total expenditure on health (Int$): $36 (2010) Government spending on health: 11% (2010) (as % of total govt spending) Out-of-pocket spending on health: 35% (2010) (as % of total health spending) Official development assistance to child health per child (US$): $48 (2009) Official development assistance to maternal and newborn health per live birth (US$): $115 (2009) Systems and financing for MNCH
: 2.8 (2008) National availability of EmOC services: 27% (2011) (% of recommended minimum) Per capita total expenditure on health (Int$): $36 (2010) Government spending on health: 11% (2010) (as % of total govt spending) Out-of-pocket spending on health: 35% (2010) (as % of total health spending) Official development assistance to child health per child (US$): $48 (2009) Official development assistance to maternal and newborn health per live birth (US$): $115 (2009) Systems and financing for MNCH")
37
Equity Liberia The wide bars for most indicators show important inequalities in coverage. Inequality is greatest for skilled birth attendant and immunizations. Only early initiation of breastfeeding shows a much smaller gap in coverage.

38
Part 3 Country Countdown Benefits and process

39
Promote use of evidence and national or subnational data in decision making Increase public & politicians awareness of RMNCH needs Highlight priorities for strengthening national data systems Data used for action Assess current domestic & external resources for RMNCH Links resources used with outcomes obtained Promote more efficient and equitable use of resources Resources maximised Increase advocacy for accelerated improvements for the health of women, newborns & children, Accountability mechanism, especially to reach the poorest Health outcomes improved Why have a Country Countdown?

40
Country-level Engagement: Guiding Principles Country centered context specific products eg subnational profiles Country led process with broad stakeholder inputs, promoting accountability Link to National Health Sector review process Technical support from global CD members

41
Program action cycle Collect and analyze data and assess system gaps and opportunities Prioritize and plan using data, identify resource gaps, equity gaps Policy change, program, implementation Track progress for coverage and equity, inputs and outcomes ADVOCACY ACCOUNT- ABILITY Country Countdown process can help strengthen your national program action cycle

42
Country Countdown experiences Senegal, 2006 High level engagement of key partners (MoH/MoF, supported by UNICEF) Strategic planning meeting for scale-up of effective MNCH interventions Zambia, 2008 MoH initiated and convened/supported by WHO & UN partners National prioritization meeting for MNC mortality reduction Nigeria, 2011 FMOH convened with Save the Children and many partners Country report and 36 state profiles, Launched by First Lady and health care professionals especially Paediatricians
 Strategic planning meeting for scale-up of effective MNCH interventions Zambia, 2008 MoH initiated and convened/supported by WHO & UN partners National prioritization meeting for MNC mortality reduction Nigeria, 2011 FMOH convened with Save the Children and many partners Country report and 36 state profiles, Launched by First Lady and health care professionals especially Paediatricians")
43
Country Countdowns: Key steps 1.Preparation/planning Form core group to coordinate technical analysis and planning, develop workplan/budget, Ensure wide stakeholder inputs 2.Process with data content and analysis Sub-national data – disaggregated to district/ provincial levels Focus on equity – geographic, ethnic, economic, and social factors Recommendations for solutions – policy and programme 3.Products/materials: National and sub-national profiles, link to existing tracking and meetings 4. Country Countdown event and media outreach 5.Follow-up: MOH, key donors/stakeholders Use evidence and data in national planning processes Involve civil society in monitoring

44
Role of in-country partners/MoH Coordination of national and global partners Identify best data sources Conduct outreach to ensure participation of key local partners/stakeholders Provide technical and financial support Analyze data, produce messages Publicize results Follow-up on recommendations

45
Role of Global Countdown Technical assistance to support countries: Assess data quality and availability Help as needed with data analysis and the development of sub-national profiles and other products Conduct regional capacity-building workshops Mobilize south-south and global learning through sharing experiences and lessons learned

46
Thank you!

47
Optional additional slides Equity profiles Liberia

48
Coverage levels in poorest and richest quintiles

49
Coverage levels in the 5 wealth quintiles

50
Co-coverage of health interventions

51
Composite coverage and coverage gap

Similar presentations


 MPH PhD Director Global Evidence and Policy Saving.>")


IS?. Purpose of HIS “is to produce relevant information that health system stakeholders can use for making transparent and evidence-based.>")


