Download presentation
Presentation is loading. Please wait.

1
Recovery of Sensitive Watersheds in the Northeastern United States from Chronic Acidification: The Role of Soil Chemistry Chris E. Johnson 1, Charles T. Driscoll 1, Richard A.F. Warby 2, Jeremy Tamargo 1, Wei Li 1, April Melvin 3 1 Syracuse University 2 Arkansas State University 3 Cornell University W. M. Keck Foundation

2
Outline Acid deposition and soil acidity Continuing acidification of soils in the northeastern USA –Long-term monitoring results –Al-Ca-H competition Mitigation options –Wollastonite experiment at Hubbard Brook, NH - 1999 –Liming experiment at Woods Lake, NY - 1989 Conclusions

3
Acid Deposition Image: (http://www.macalester.edu/) SO 2 NO x H 2 SO 4 HNO 3 H + SO 4 2- NO 3 -

4
Decline in Acid Deposition Data: National Atmospheric Deposition Program (http://nadp.sws.uiuc.edu/)

5
Surface Waters Are Showing Chemical Recovery Decreased SO 4 2- in drainage waters. Increased pH, ANC. Decreased Al concentrations. BUT: ANC recovery is sluggish. Base cation concentrations continue to decline. Constable Pond, NY Warby et al. (2005)
.")
6
Hypothesis The recovery of surface waters in the northeastern U.S. from acid rain is hindered by continuing acidification of soils.

7
What is Soil Acidity? “Acid Cations”: H, Al, (Fe and trace metals) H + + H 2 O → H 3 O + Al 3+ + 2H 2 O → AlOH 2+ + H 3 O + Cu 2+ + 2H 2 O → CuOH + + H 3 O + “Base Cations”: Ca, Mg, Na, K (other Group I, II) Do not act as bases (!) Non-acidic
 H + + H 2 O → H 3 O + Al H 2 O → AlOH 2+ + H 3 O + Cu H 2 O → CuOH + + H 3 O + Base Cations : Ca, Mg, Na, K (other Group I, II) Do not act as bases (!) Non-acidic.")
8
What is Soil Acidity? “Exchangeable Cations” Displaceable by neutral salts KCl, NH 4 Cl LowHigh Binding Strength “Bound Cations”: Require stronger complexing agent BaCl 2 + TEA (Total Acidity) CuCl 2 (Al, Fe) Thus: Bound Al = Al CuCl 2 - Al KCl
 CuCl 2 (Al, Fe) Thus: Bound Al = Al CuCl 2 - Al KCl.")
9
Approach Sample soils from watersheds studied in the Direct/Delayed Response Program (DDRP) – 1984. Samples collected in 2001-02. Same chemical methods as DDRP, to the extent possible.

11
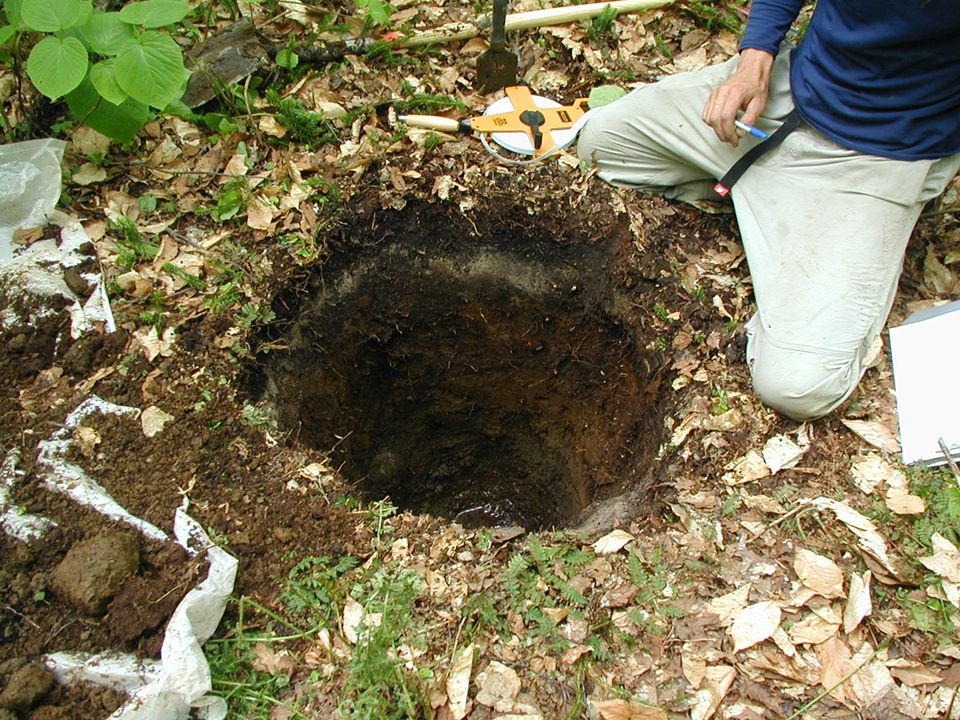
Oa Horizon

12
Region-Wide Results: Oa Horizons 1984 Median 2001 Median Significance Calcium, cmol c (kg C) -1 23.510.6P < 0.01 Aluminum, cmol c (kg C) -1 8.821.3P < 0.01 Acidity, cmol c (kg C) -1 23.638.0P < 0.01 CEC e, cmol c (kg C) -1 62.760.6None pH3.142.98P < 0.05 Base Saturation, %56.233.0P < 0.01 (Warby et al. 2009)
.")
13
Sub-Regional Results: Oa Horizon * * * * * * * * * * * Sample Size (N): Region19842001 All7555 ADR28 CATPOC108 CNE/Maine3719 * Indicates P < 0.05 (Warby et al. 2009)
.")
14
Bhs Horizon?

15
or Bs Horizon?

16
Bhs Horizon here?

17
Bhs Horizon or here?

18
Two Horizons?

19
or Three?

20
Equal-Area Quadratic Splines A series of local quadratic polynomials that join at “knots” located at the horizon boundaries (Bishop et. al, 1999). Area to the left of the fitted spline (“X”) is equal to the area to the right of the spline (“Y”) (Ponce-Hernandez, 1986). (Ponce-Hernandez et al.,1986) Mean value of each horizon is maintained by the spline. Minimizes the true mean squared error (Bishop et. al, 1999).
. Area to the left of the fitted spline ( X ) is equal to the area to the right of the spline ( Y ) (Ponce-Hernandez, 1986). (Ponce-Hernandez et al.,1986) Mean value of each horizon is maintained by the spline. Minimizes the true mean squared error (Bishop et. al, 1999)..")
21
Equal-Area Quadratic Splines Continuous depth- concentration function computed by the spline-fitting program. Mean concentration of analyte calculated for user-specified depth segment (e.g., 0-10 cm).
..")
22
Adirondack Results: Mineral Soils 0-10 cm 1984 Mean2001 MeanSignificance Calcium, cmol c kg -1 0.770.43P < 0.01 Aluminum, cmol c kg -1 4.344.82NS Acidity, cmol c kg -1 5.575.79NS 10-20 cm 1984 Mean2001 MeanSignificance Calcium, cmol c kg -1 0.600.37P < 0.01 Aluminum, cmol c kg -1 3.586.25P < 0.01 Acidity, cmol c kg -1 4.407.25P < 0.01

23
Central New England Results: Mineral Soils 0-10 cm 1984 Mean2001 MeanSignificance Calcium, cmol c kg -1 2.36 0.41P < 0.01 Aluminum, cmol c kg -1 2.462.84NS Acidity, cmol c kg -1 2.833.19NS 10-20 cm 1984 Mean2001 MeanSignificance Calcium, cmol c kg -1 1.820.36P < 0.01 Aluminum, cmol c kg -1 1.442.15P < 0.05 Acidity, cmol c kg -1 1.622.16NS

24
Soil pH Unrelated to Base Saturation

25
Al-H Competition Dominates Exchange Chemistry

26
Wollastonite Addition: Hubbard Brook Watershed 1, 1999

27
Motivation for Wollastonite Addition “Replace” Ca depleted from soils by: –Acid rain –Successional vegetation growth Why wollastonite (CaSiO 3 )?
")
28
Soil Hypotheses 1.Wollastonite application will result in increased total and exchangeable Ca in W1 soils. 2.Increases in exchangeable Ca will be accompanied by decreased exchangeable acidity (Al + H). 3.Soil chemical change will occur over many years, in a “chromatographic” manner.
. 3.Soil chemical change will occur over many years, in a chromatographic manner..")
29
Changes in Total Ca in W1 Soils 1998: Pre-treatment measurement of total Ca. Oi+Oe and Oa collected from “pin blocks”. Top 0-10 cm of mineral soil collected using a corer.

30
Changes in Total Ca in W1 Soils 1998-1999: 1,028 kg/ha of Ca added to W1 in October, 1999.

31
Changes in Total Ca in W1 Soils 1998-2000: The year after the addition, most of the added Ca could be accounted for in the Oi+Oe horizons. Some was probably not dissolved by 5M HNO 3

32
Changes in Total Ca in W1 Soils 1998-2002: Calcium content of Oi+Oe layer decreased, while Ca content of the Oa horizon increased. No significant effect in the 0-10 cm mineral soil layer.

33
1998-2006: Data clearly show penetration of Ca downward in the soil, and into the mineral soil. Changes in Total Ca in W1 Soils

34
1998-2010: Data clearly show penetration of Ca downward in the soil, and into the mineral soil. Changes in Total Ca in W1 Soils

35
“Total” Calcium (kg/ha) ± Std. Error Horizon19982000200220062010 Oi + Oe144 ± 10989 ± 62825 ± 52620 ± 38355 ± 24 Oa106 ± 14119 ± 10212 ± 19156 ± 15124 ± 15 Upper Mineral Soil 91 ± 784 ± 1197 ± 9166 ± 15226 ± 15 Total340 ± 181191 ± 651133 ± 65942 ± 50705 ± 39 Change from Previous Sampling Year +851-58-191-237 Distribution of Added Wollastonite

36
“Total” Calcium (kg/ha) ± Std. Error Horizon19982000200220062010 Oi + Oe144 ± 10989 ± 62825 ± 52620 ± 38355 ± 24 Oa106 ± 14119 ± 10212 ± 19156 ± 15124 ± 15 Upper Mineral Soil 91 ± 784 ± 1197 ± 9166 ± 15226 ± 15 Total340 ± 181191 ± 651133 ± 65942 ± 50705 ± 39 Change from Previous Sampling Year +851-58-191-237 Distribution of Added Wollastonite At least 486 kg/ha of added Ca is no longer in the Oie, Oa, or top 10 cm of mineral soil.

37
At least 486 kg/ha of added Ca is no longer in the O horizons or upper mineral soil (previous slide). Transport to lower mineral soil horizons –Immobilized on exchange sites? –Lost to stream water? Taken up by forest vegetation –Clearly indicated by isotopic evidence –Compare to 753 kg/ha of Ca reported for W6 in 1992 (Likens et al. 1998) Other fates? Fate(s) of Added Wollastonite
 Other fates. Fate(s) of Added Wollastonite.")
38
1998-2010: Exchangeable calcium increased in all sampled layers after wollastonite treatment. Exchangeable acidity (Al+H) declined in all layers, though not in a compensatory fashion. Data reflect a progressive downward migration of Ca in the soil. Significant changes were detected in the Oi+Oe horizon in 2000, while changes did not occur until 2002 in the Oa horizon, and 2006 in the mineral soil. Changes in Exchangeable Cations in W1 Soils
 declined in all layers, though not in a compensatory fashion. Data reflect a progressive downward migration of Ca in the soil. Significant changes were detected in the Oi+Oe horizon in 2000, while changes did not occur until 2002 in the Oa horizon, and 2006 in the mineral soil. Changes in Exchangeable Cations in W1 Soils.")
39
1998-2010: The observed increases in exchangeable Ca were not fully compensated by decreases in exchangeable Al and/or H. As a result, CEC e increased in the Oi+Oe and Oa horizons. Note: Exchangeable Ca accounted for 30-60% of ‘total’ Ca prior to the wollastonite addition. Changes in Exchangeable Cations in W1 Soils

40
Nezat et al. (2010) proposed three stages to explain increases in stream water Ca concentrations. The penetration of Ca into mineral soils that we observed after 2002 (Year 3) coincides with their “infiltration” stage, in which wollastonite-derived Ca is believed to reach the stream from soil sources. Figure from Nezat et al. (2010). Soil Patterns and Stream Water
 coincides with their infiltration stage, in which wollastonite-derived Ca is believed to reach the stream from soil sources. Figure from Nezat et al. (2010). Soil Patterns and Stream Water.")
41
1998-2002: Prior to the wollastonite addition, there was a spatial gradient in base saturation in the O horizons, with lower values at higher elevations. The treatment resulted in the elimination of this spatial gradient, indicating that exchangeable Ca increased most at upper elevations. Figure from Cho et al. (2010). Changes in Exchangeable Ca in W1 Soils
. Changes in Exchangeable Ca in W1 Soils.")
42
Woods Lake Watershed Liming Experiment 2-1 2-2 3-1 3-2 4-2 4-3 II IV III V 5-1 Sub-watersheds II and IV limed in 1989. Sub-watersheds III and V not limed - controls. Transects sampled in 2008. Pre-treatment data – Blette et al. (1996)
.")
43
Liming Effects on Soil Chemistry (20 Years)
")
44
Liming Effects on Soil Chemistry

45
Ca-Al Dynamics After Liming

46
Conclusions 1.Organic and mineral soil horizons in the northeastern USA experienced substantial decreases in exchangeable Ca, and increases in exchangeable Al between 1984 and 2001-02. 2.The continuing acidification of soils may help explain the sluggish recovery of ANC in regional surface waters. 3.The principal competitors for cation exchange sites in regional soils are Al and H, not Al and Ca. It is therefore unlikely that the base status of these soils will improve markedly with reductions in acid inputs. 4.Mitigation using Ca amendments is a viable option for improving soil base status. Data from Hubbard Brook and Woods Lake indicate that long-term increases in soil Ca are sustainable.

Similar presentations


 – a Norwegian.>")


 results in a rain pH of 5.7: This pH can be modified by natural acids (H 2 SO 4, HNO 3, RCOOH…)>")


>")

 If (H + ) = 1 x 10 -3 mol/L (H + ) = 0.001 mol/L pH = - log (1 x 10 -3 ) pH = - (-3)>")


