Download presentation
Presentation is loading. Please wait.

1
Using Data to Identify Priorities in an Accountability System Jared E. Knowles, Wisconsin Department of Public Instruction

2
Opening Thought

3
Outline and Purpose Provide context and background on Wisconsin’s position nationally on education indicators Provide context on the economic situation in Wisconsin which students are being prepared for Provide information about key indicators of Wisconsin performance using current data Focus attention on key areas that can inform and instruct an accountability system

4
Where is Wisconsin’s testing and the economy today? Context

5
Some definitions Scale score—a student’s score on a standardized test Cutpoints—the scale score that divides categories of performance like proficient and not-proficient TIMSS—Trends in International Mathematics and Science Study, an international assessment NAEP—National Assessment of Educational Progress, a national assessment in several subjects Correlation—a measure from 0 to 1 of the interdependence of two measures

6
Scale Score Cutpoints in Perspective Wisconsin sets proficiency cutpoints in reading well below NAEP basic and below other states

7
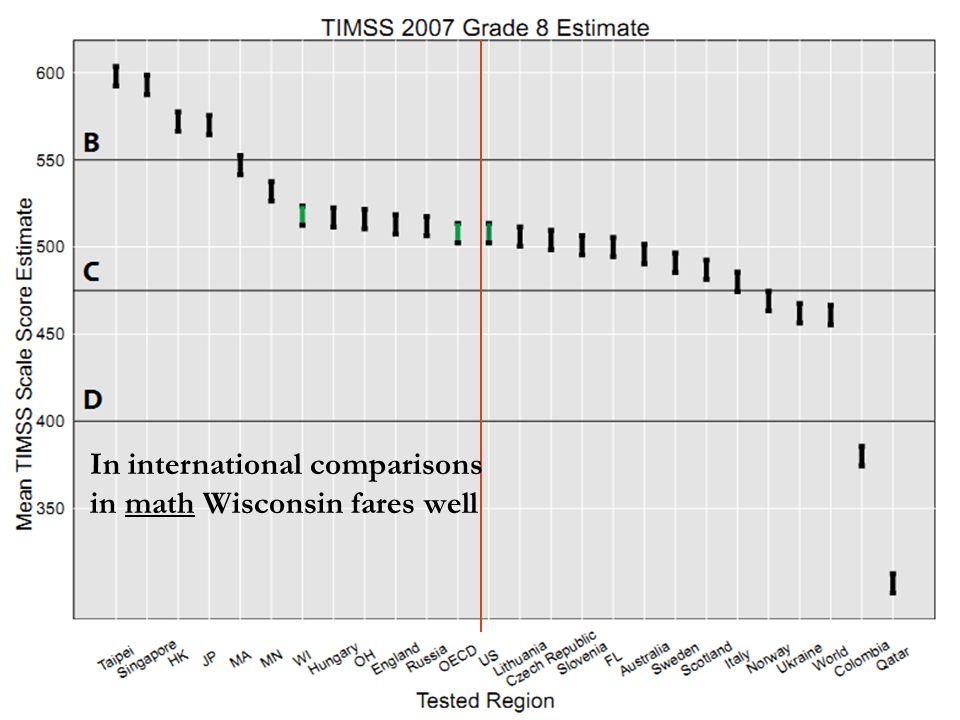
In international comparisons in math Wisconsin fares well

9
Basic Proficient C range B range Wisconsin outperforms many states in math on TIMSS and NAEP

10
Proficient Basic C range B range Wisconsin outperforms many states in math on TIMSS and NAEP

11
Many jobs require no post-secondary training or education, but several do require this

12
Education Matters for Unemployment Source: NPR Planet Money Podcast #294: Planet Money Live (July 29, 2011); Bureau of Labor Statistics July 2011 Report (USDL-11-1151)
; Bureau of Labor Statistics July 2011 Report (USDL )")
13
Waitstaff, food service, etc. Customer service Registered nurses Pharmacist Chief Executive Lawyers High wage jobs require training after high school

14
Growing Poverty Proportion of students living in poverty in 2005

15
Poverty today

16
The Future — Racial Change Data calculated from NCES projections from 2009

17
Where do we struggle to educate children? Achievement Gaps

18
Racial Breakdown of Grade 4 in 2009-2010

19
Conditional Density of G4 WKCE Reading Students of color make up a much larger proportion of our low performing students

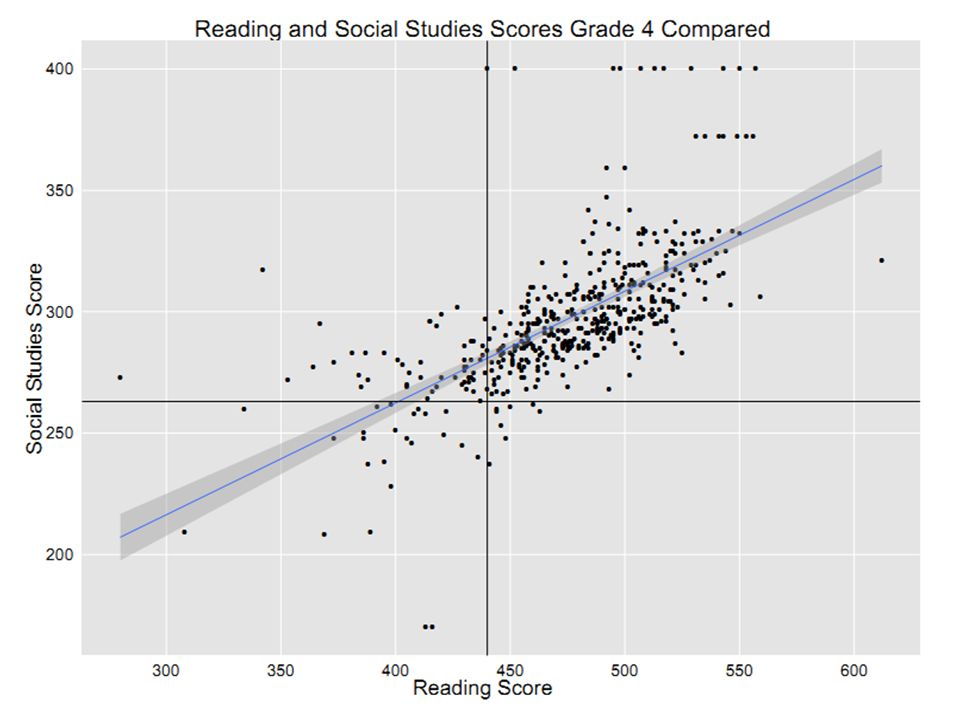
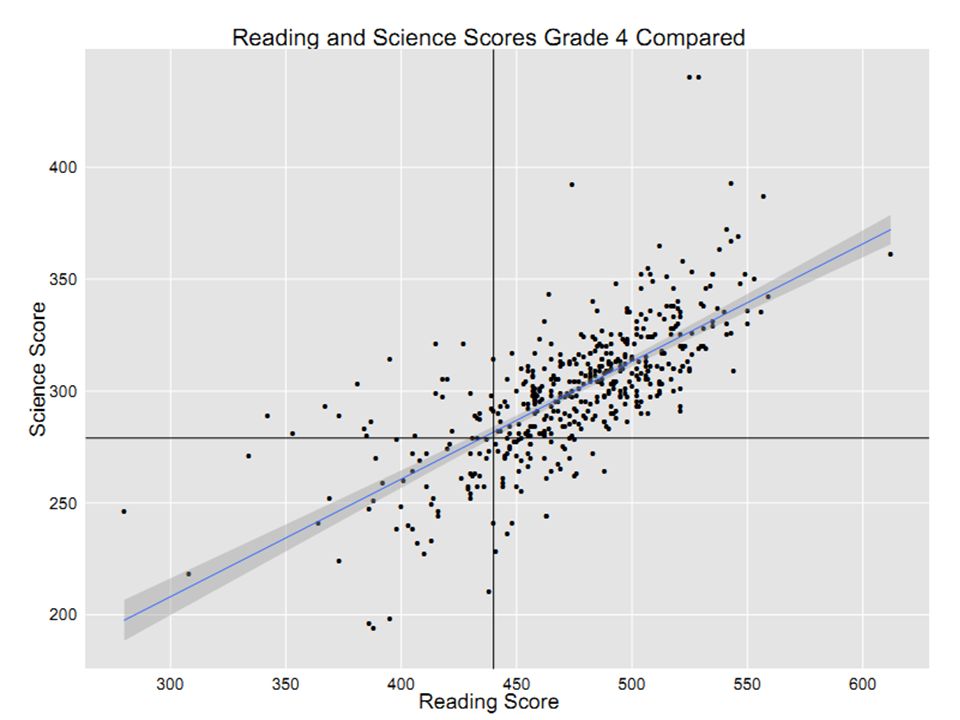
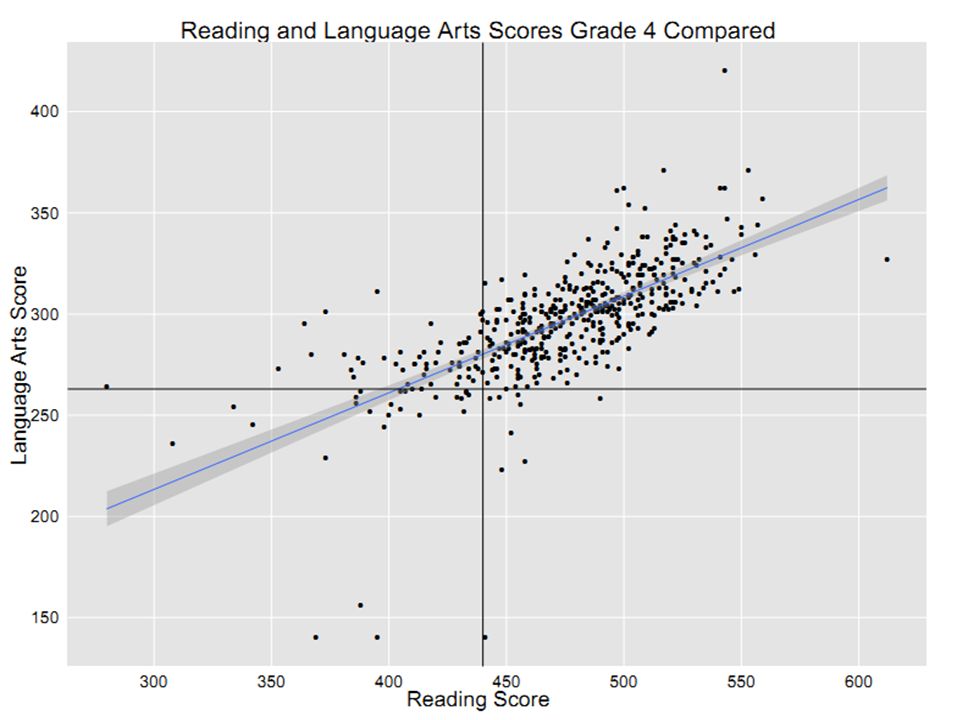
20
Speech and Language– 13,962 Specific LD– 15,613 There are large disparities among the disability classifications in performance

21
Split by Economic Disadvantage Racial gaps exist across economic differences

22
Students that start below proficient on average stay below proficient

23
Econ Gap Split by CESA Economic gaps exist across regions of the state

24
When can we help kids most? Transitions

25
Why transitions? By focusing on predicting student outcomes we can intervene early and more effectively Several indicators give a good idea of student achievement in the near and long-term that are available immediately Disciplinary events Attendance and engagement Prior test record Language acquisition At different points in time there will be different indicators that matter more, but the key is focusing on what they say about the likely future

26
What kinds of indicators matter? Research shows that a number of indicators can provide an ‘early warning’ 6 th grade attendance Disciplinary events (suspensions, expulsions) early in a student’s career Course completion and instructional time in 9 th grade Standardized test performance Failing courses in high school Direct measures of student engagement
 early in a student’s career Course completion and instructional time in 9 th grade Standardized test performance Failing courses in high school Direct measures of student engagement.")
27
Dropouts Matter

28
From Reaction to Prediction—An Example WKCE + Behavior WKCE / ACT College / Career Outcomes In early grades we predict later grade WKCE with behavior and test results Using predictions about late WKCE link to ACT performance we calculate ACT performance ACT provides a stable link to college performance

29
What does this mean? So we can use this WKCE / ACT link to estimate what ‘track’ a student is on early in career Interventions can be targeted, benchmarks set, and changes made to move student upward—starting backward from the premise of ACT scores We can do some of this today to estimate how current graduates may perform

30
Some Estimates of College Success 2008-2011 ACT Takers Breaking scores down into bands predictive of college success (<18, 19, 20-21, 22-26, 26+) and using historic rates of remedial coursework for those students from 2005-2007 ACT data, we can estimate that: 68,563 Wisconsin students (26% of ACT takers in this time) will need remedial coursework in mathematics 25,558 Wisconsin students (10%) will need remedial coursework in English That is a full graduating cohort every four years requiring additional mathematics remedial work
 and using historic rates of remedial coursework for those students from ACT data, we can estimate that: 68,563 Wisconsin students (26% of ACT takers in this time) will need remedial coursework in mathematics 25,558 Wisconsin students (10%) will need remedial coursework in English That is a full graduating cohort every four years requiring additional mathematics remedial work")
31
English Remediation Projections 2008-2011 ACT ACT English Score Avg. Remediation Rate StudentsAverage Rate of Completing Remediation in One Year Students not on track in year 2 of college <1830%23,01970%6,906 196%91470%274 20-212.9%1,23070%369 22-260.5%39570%119 26+0%070%0 TOTAL 7,668

32
Math Remediation Projections 2008-2011 ACT ACT Math Score Avg. Remediation Rate StudentsAverage Rate of Completing Remediation in One Year Students not on track in year 2 of college <1867%51,73660%20,694 1937%5,56460%2,226 20-2120%1,23060%492 22-266%5,42360%2,169 26+0.3%15260%91 TOTAL 25,672

33
Students that start below proficient on average stay below proficient

34
Students that start below proficient in reading can move into above proficient in math

35
Grade 4 Reading Achievement 2009-10 FRL Students Excluding MPS and SwD ELL black urban FAY disciplineFAY discipline indian ELL status, race, mobility, and disciplinary status sharply divide student achievement

36
Literacy is Foundational Reading and beyond

37
NAEP Performance in 1994 Few states rank above WI in 1994

38
NAEP Performance in 2009 More states rank above WI in 2009

39
Correlation of WKCE Subjects in Grade 4 Reading correlates with other subjects more than math

40
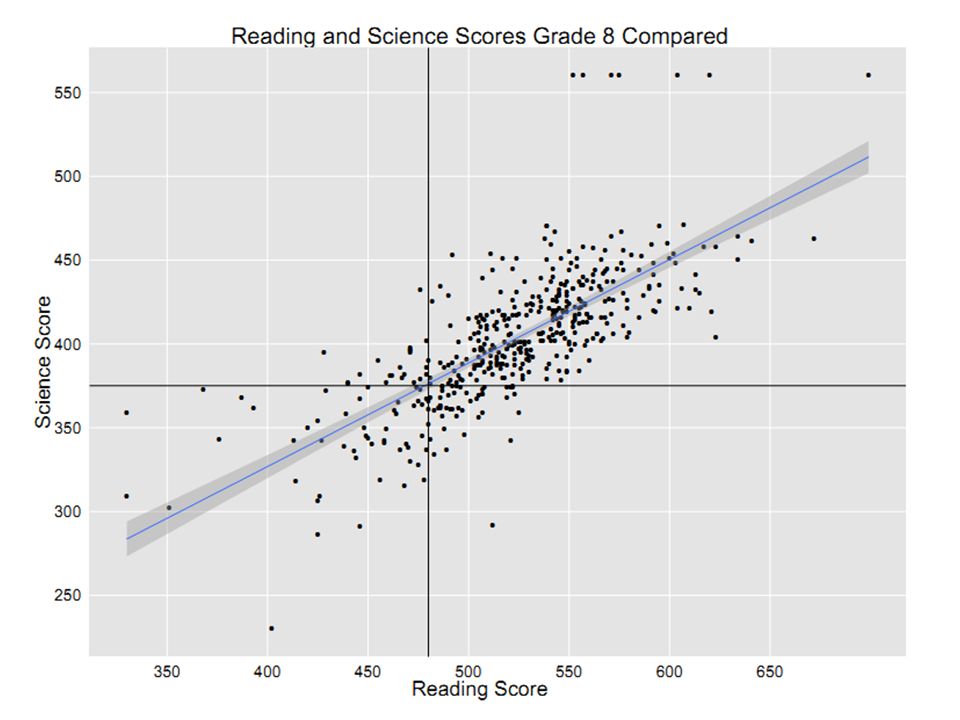
Correlation of WKCE Subjects in Grade 8 Reading correlates with other subjects more than math

45
Questions? Extra slides available

46
Economic Gap by Race and Locale

Similar presentations


 Education Commission of the States June 27, 2013 Virginia Department of Education.>")


>")


