Download presentation
Presentation is loading. Please wait.

1
An AEA Skills Building Workshop presented by James W. Altschuld The Ohio State University Hsin-Ling Hung University of North Dakota Yi-Fang Lee National Taiwan Normal University Annual Meeting of the American Evaluation Association November, 2011 Anaheim, California

2
Objectives/Agenda Objectives Understand the Needs Assessment Process Learn where causal analysis fits the picture Brief look at causal analysis procedures Cause consequence analysis Fault tree analysis (FTA) Fish boning A hands-on FTA activity Have an opportunity to discuss the experience and have some fun on a brief journey into NA Provide a glimpse into the Needs Assessment Kit (Altschuld, Eastmond, King, Kumar, Stevahn, and White, 2010)
 Fish boning A hands-on FTA activity Have an opportunity to discuss the experience and have some fun on a brief journey into NA Provide a glimpse into the Needs Assessment Kit (Altschuld, Eastmond, King, Kumar, Stevahn, and White, 2010)")
3
Agenda Introduction (1 minute) Questions (2-4 minutes) Basic NA terms and concepts (8-10 minutes) Overview of Ways to Determine Causality (ways things can or do fail (15 -18 minutes) Cause consequence analysis Fish boning Fault Tree Analysis Comparative discussion embedded Hands-on work, discussion, etc. (rest of time for the session)
.")
4
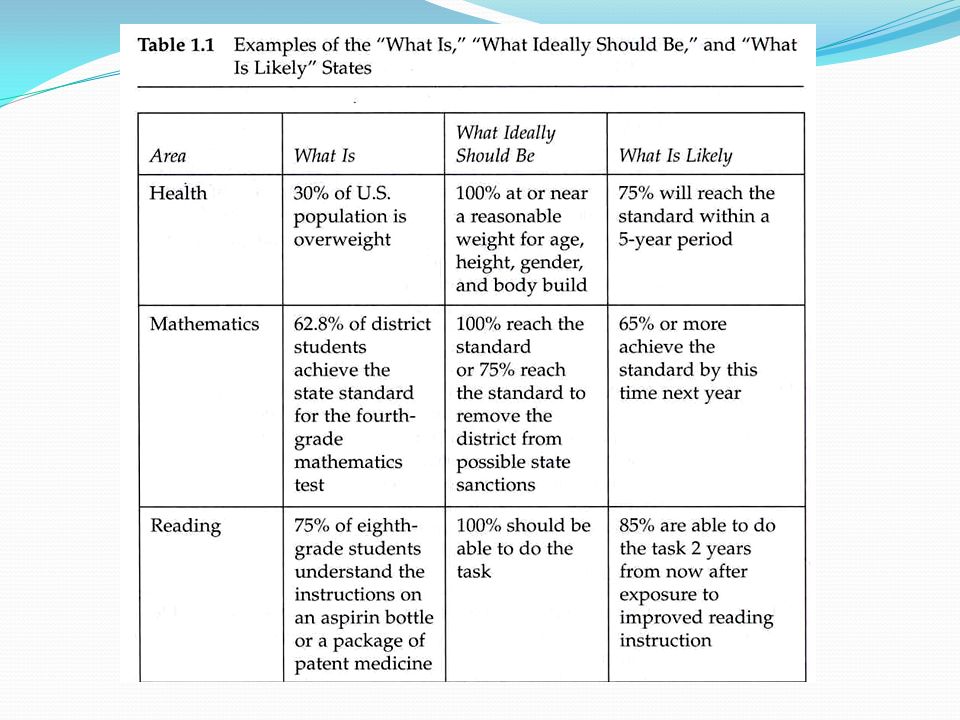
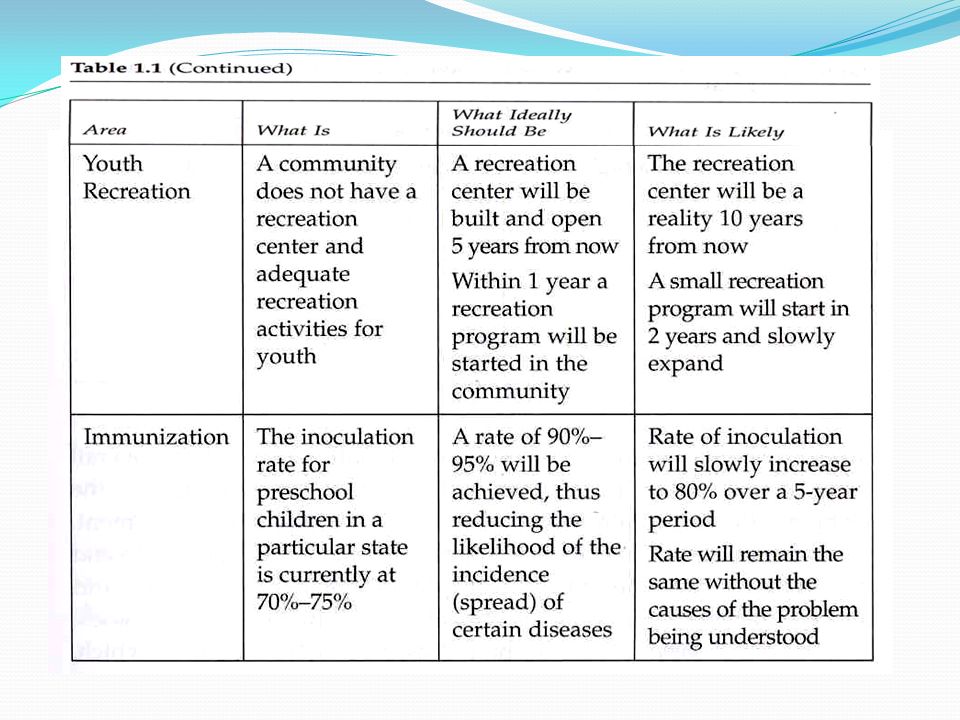
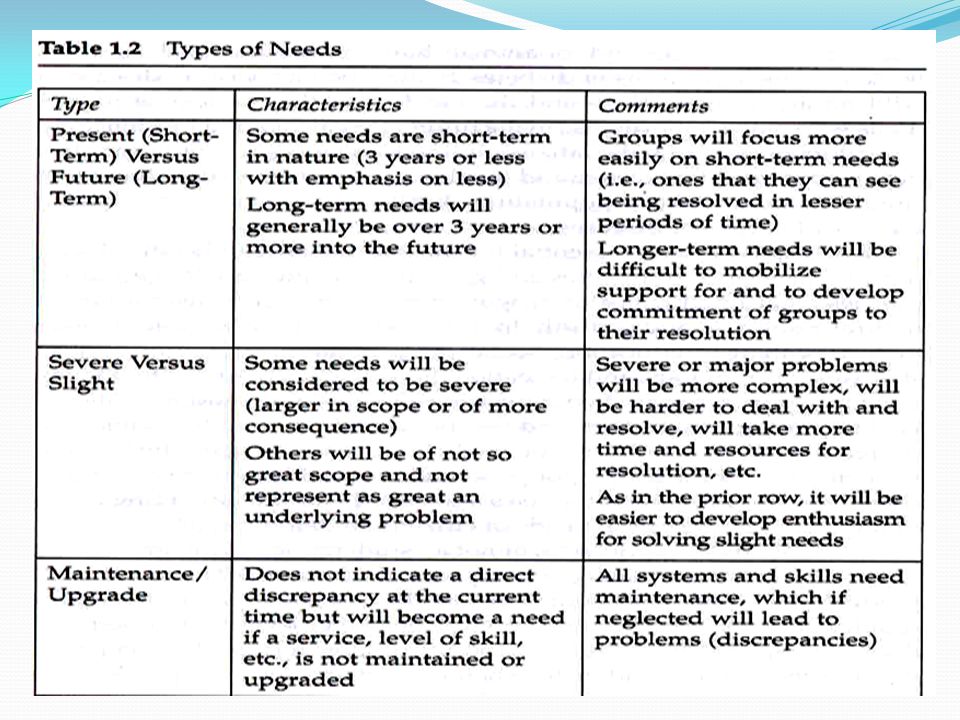
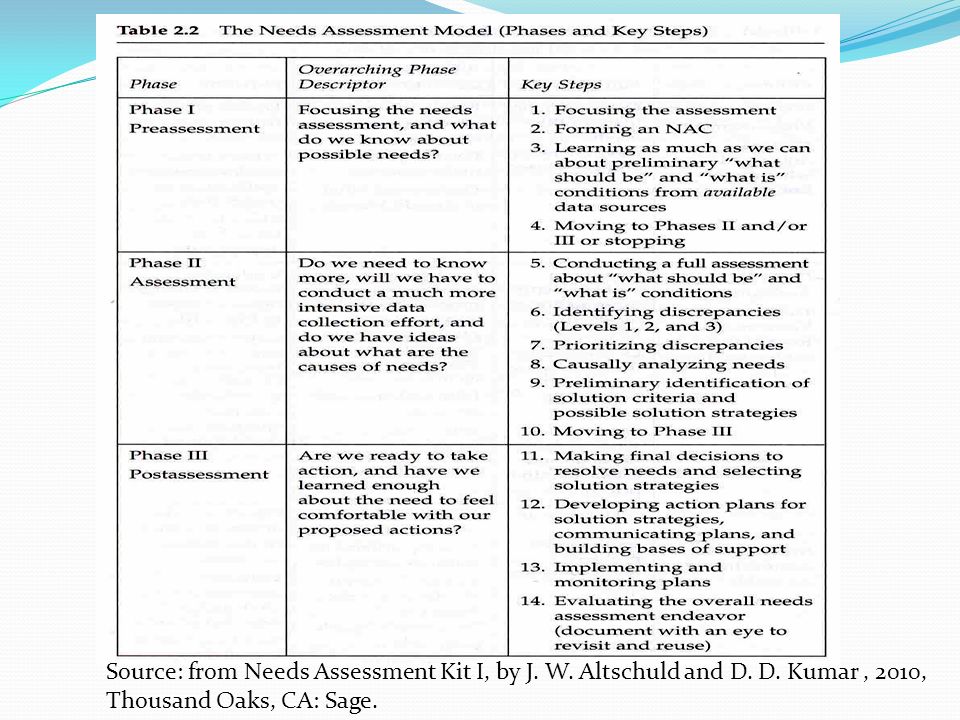
Beginnings Questions for you How many have done NAs? Have your NAs resulted in solutions to problems? Were the solutions implemented? Did you do causal analysis re identified needs? Did you analyze possible ways that solutions could fail? Did you run into failures in the NA itself or solution strategies – could they have been prevented? Terms/concepts Need -definition -not mixing solutions with needs -examples of needs (see partial table in Kit book 1) -types of needs (book 1) -levels of needs -many issues at the outset Needs assessment -three phase model (see schematic) -where causal analysis might fit -issue when to prioritize (prior to or after causal analysis)
 -types of needs (book 1) -levels of needs -many issues at the outset Needs assessment -three phase model (see schematic) -where causal analysis might fit -issue when to prioritize (prior to or after causal analysis).")
5
Definitions & Issues Need: the measurable discrepancy between “what is” or the present state of affairs in regard to the group and situation of interest and the “what should be” or desired state of affairs (Witkin & Altschuld, 1995). Issues: measurable discrepancy is the key -needs not solutions (premature closure on solutions) -verb vs. noun concept (misuse of the word) -‘desired’, ‘likely to occur’, ‘ought to occur’, etc. -wish and want lists -many types of needs
 -verb vs. noun concept (misuse of the word) -‘desired’, ‘likely to occur’, ‘ought to occur’, etc. -wish and want lists -many types of needs.")
6
More Terms/Concepts NA is a systematic set of procedures undertaken for the purpose of setting needs-based priorities and making decisions about organizational improvement and allocation of resources (Witkin & Altschuld, 1995). Issues -context for the NA -readiness for an assessment -NA is an organizational activity -political aspects to the activity -systems concept and how to think about it -remember causal analysis deals with how things fail for the most part Lots of subtle aspects of need and NA Examples Types

9
Source: from Needs Assessment Kit Ι, Book 1 by J. W. Altschuld and D. D. Kumar, 2010, Thousand Oaks, CA: Sage.

12
Source: from Needs Assessment Kit Ι, by J. W. Altschuld and D. D. Kumar, 2010, Thousand Oaks, CA: Sage.

14
Causal Analysis – General Notions One use, what causes discrepancies -key reasons why they exist -if identified, better solutions -tells what underlies failure & where to pinpoint solutions Second use, where solutions might fail - lead to solutions with less likelihood of failure - might reduce risk in what we do in programs - not seen often in NA -sometimes in policy analysis -enhance probability of success Generally follow the Pareto principle -in large groups, small percentage do most of the talking -80/20 rule –in a country 20% of people control 80% of the wealth -if you have 100 causes of a problem only a small number really cause it (note: causes may interact) What could possibly lead to a need -brainstorm potential causes -success/logic maps useful in causal analysis but now the interest is on failure What could go wrong, what has gone wrong, and why type of thinking
 What could possibly lead to a need -brainstorm potential causes -success/logic maps useful in causal analysis but now the interest is on failure What could go wrong, what has gone wrong, and why type of thinking")
15
Method one – Cause consequence analysis Originally Fault Hazard Analysis (Witkin) CCA is very simplified Fault Tree FTA is time consuming to construct detailed, complex not easily understood due to terms CCA is simpler to construct/use takes less time does not use tree format not much quantification is mostly qualitative in nature Broad Steps examine systems map id/brainstorm possible failures ask key questions/come up with ideas fill in chart individually/as group see figure on right Why the systems map is important and the notion of criticality ratings
 CCA is very simplified Fault Tree FTA is time consuming to construct detailed, complex not easily understood due to terms CCA is simpler to construct/use takes less time does not use tree format not much quantification is mostly qualitative in nature Broad Steps examine systems map id/brainstorm possible failures ask key questions/come up with ideas fill in chart individually/as group see figure on right Why the systems map is important and the notion of criticality ratings")
16
Method 2 – Fault Tree Analysis (FTA) Look at CCA – what is lost quantification causal pathways closer look at most likely causes deeper analysis due to simplicity logic gates (explained later) possibly causal interaction FTA from systems concepts (engineering) different way to look at world increase success by analyzing most likely modes of failure Advantages logical, probing way of thinking in depth look at system quantification ID most likely failure paths use of logic gates worth the time if system is complex or risks are high Other features reverses usual way of thinking many uses in engineering space program (Challenger disaster) Less apparent in education, social, programs, etc reading example from class Disadvantages time complexity lack of familiarity
 Look at CCA – what is lost quantification causal pathways closer look at most likely causes deeper analysis due to simplicity logic gates (explained later) possibly causal interaction FTA from systems concepts (engineering) different way to look at world increase success by analyzing most likely modes of failure Advantages logical, probing way of thinking in depth look at system quantification ID most likely failure paths use of logic gates worth the time if system is complex or risks are high Other features reverses usual way of thinking many uses in engineering space program (Challenger disaster) Less apparent in education, social, programs, etc reading example from class Disadvantages time complexity lack of familiarity")
17
Simplified Guts of FTA 1. Define system to be assessed (logic or success map) Analogous to CCA and Fishbone diagrams 2. Examine the map for stress points where the system can fail 3. Define Undesirable Events (UEs) – may need separate trees for each so may want to prioritize UEs 4. Place UE at the top of page or tree –think of an XMAS tree analogy 5. Individuals brainstorm causes of UE 6. Cluster causes together –label and place labeled cluster under the UE with arrow leading up to it 7. Group then discusses clusters and possible causes within each 8. Construct first draft of FT 9. Review/refine change 10. Result is a qualitative tree 11. Quantify the tree 12. ID the most probable path to failure 13. Contribution of causes on a similar line to next level (sum to 100%) 14. Factor in likelihood of a cause (.1 = low,.2 = medium,.4 = high) 15. Specify logic gates since it is critical in establishing path 16. Best illustrated by examples
 Analogous to CCA and Fishbone diagrams 2. Examine the map for stress points where the system can fail 3. Define Undesirable Events (UEs) – may need separate trees for each so may want to prioritize UEs 4. Place UE at the top of page or tree –think of an XMAS tree analogy 5. Individuals brainstorm causes of UE 6. Cluster causes together –label and place labeled cluster under the UE with arrow leading up to it 7. Group then discusses clusters and possible causes within each 8. Construct first draft of FT 9. Review/refine change 10. Result is a qualitative tree 11. Quantify the tree 12. ID the most probable path to failure 13. Contribution of causes on a similar line to next level (sum to 100%) 14. Factor in likelihood of a cause (.1 = low,.2 = medium,.4 = high) 15. Specify logic gates since it is critical in establishing path 16. Best illustrated by examples.")
18
Figure Illustration of an OR gate

19
Figure Illustration of an AND gate

20
Rudimentary success map for a program designed to reduce the back problems of employees of and Nationwide Moving Company

21
Rudimentary fault tree branch using an OR gate

22
Rudimentary fault tree branch using an AND gate

23
Two branches of a fault tree for the Moving Company Wellness Program

24
Fish-Bone Approach via Diagrams Same type of thinking as before Advantages Quick Fun type of activity May work as well as other approaches Disadvantages Lack of quantification Most likely do not get at critical path Best illustrated by examples

25
Figure General fishbone structure

26
Fishbone diagram for the problem, “Bad-Tasting Coffee”

27
Process Fishbone for determining causes of a production defect- ”Steel Pipe Scars”

28
Now the Hands-on Exercise Scenario type orientation You are the FT Analyst Individually /then collectively consider the following UEs UE 1 Failure to complete graduate program with a degree UE 2 US consumption of foreign energy is increasing and will continue to do so For UE 1 or 2 ask yourself What might be causing these situations Why don’t students complete (family, money, academics, health, time, etc.) What causes dependence on foreign sources (local resources, politics, technology, lifestyles, etc.) List as many causes as you can Cluster them together Label the clusters Construct a quick FTA map of causes leading to UE Meet as a small group to discuss and compare Structure a group version if you have time Discussion and closure
 What causes dependence on foreign sources (local resources, politics, technology, lifestyles, etc.) List as many causes as you can Cluster them together Label the clusters Construct a quick FTA map of causes leading to UE Meet as a small group to discuss and compare Structure a group version if you have time Discussion and closure")
Similar presentations


 –why? increasing complexity –ICBM’s (then TMI, Therac, Challenger...)>")


,>")


