Download presentation
Presentation is loading. Please wait.

1
Microarray Data Analysis Roy Williams PhD; Burnham Institute for Medical Research

2
Aims Load normalised illumina data into GeneSpring (undiff verses diff stem cells) Cancel GeneSpring normalisation Define biological replicates Discover significantly differentially regulated genes (undiff verses diff stem cells) Compare this list to Gene Ontologies Attempt to make a conclusion
 Cancel GeneSpring normalisation Define biological replicates Discover significantly differentially regulated genes (undiff verses diff stem cells) Compare this list to Gene Ontologies Attempt to make a conclusion")
3
Essential Tools GeneSpring: http://www.chem.agilent.com/Scripts/Generic.ASP?lPage=35082&indcol=Y&prodcol=Y Download Demo version Quantiles Normalised Stem Cell Dataset Select data from either: –StemCellCommunity.org database –NIH GeneExpressionOmnibus database –http://www.ncbi.nlm.nih.gov/projects/geo/

4
Stem Cell Microarray Database Automatically exports normalised data table!!! GCT table format is widespread!!!

5
After QC for low confidence genes (P<0.99) Note: ~50 replicate beads per array Median Outliers 25% quartile 75% quartile BAD CHIP BOXPLOT REPRESENTATION OF DATA SPREAD CHIP NUMBER SIGNAL INTENSITY
 Note: ~50 replicate beads per array Median Outliers 25% quartile 75% quartile BAD CHIP BOXPLOT REPRESENTATION OF DATA SPREAD CHIP NUMBER SIGNAL INTENSITY")
6
The effect of quantiles Normalisation on the filtered 36 data sets IMPORTANT: use non-linear normalisation >library(affy) >Qdata <- normalize.quantiles(Rawdata) All same range
 >Qdata <- normalize.quantiles(Rawdata) All same range")
7
Normalised Tutorial Dataset Using this tool generated the dataset: outputTueJul2050182007.gct (.gct is portable!) 1334328026AES_derived Neural stem cells 1334328025AES_derived Neural stem cells 1334328027AES_derived Neural stem cells 1351945015EES cells_ undifferentiated 1351945015FES cells_ undifferentiated 1473301122DES cells_ undifferentiated
 AES_derived Neural stem cells AES_derived Neural stem cells AES_derived Neural stem cells EES cells_ undifferentiated FES cells_ undifferentiated DES cells_ undifferentiated")
8
Genome Import: File ->import genome Load the illumina chip information into GeneSpring

9
Drag and Drop loads datafile

10
Define columns using drop down boxes

11
Define sample attributes (or not)
")
12
Give new experiment a name and save

13
Define new experiment normalisations and parameters New data set loaded appears here

14
Delete the default normalisations

15
ALL GONE!

16
IMPORTANT! DEFINE REPLICATES (PARAMETERS)
")
17
Define the custom parameter “group”

18
Groups define the replicates (use exactly the same text!)
")
19
Change the interpretation to look at the “group” replicates

20
Filter on expression level: Remove the genes which are not expressed (ie absent)
")
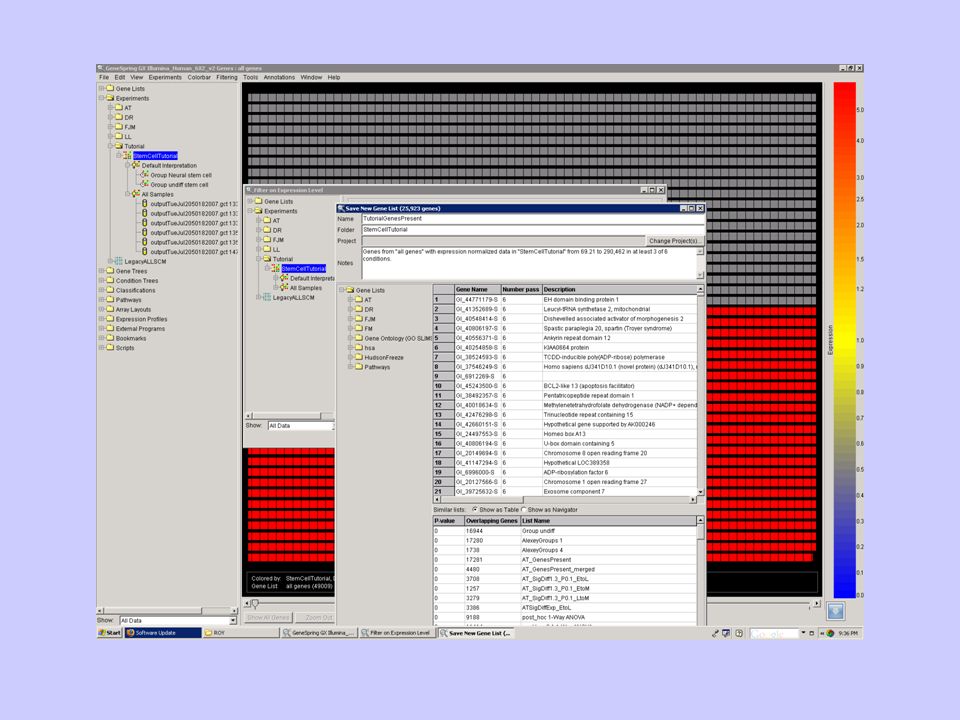
21
Filtering leaves 25,923 of 49,009 genes: save list as GenesPresent

23
Reset colour bar range Right click on Colour bar

25
Using the now default interpretation the data is in 2 groups

26
To find differentially expressed gene filter on Volcano Plot

27
With these filters gives a list of ~1800 genes: save list

28
Export the list with the averaged data: copy annotated GeneList

29
Select annotations to export

30
Paste average data into an Excel worksheet

31
Export all the data and see it is highly reproducible

32
Check list against GeneOntologies: Development is major group

33
Look for Pathways significantly differentially expressed Load into Nextbio and Ingenuity GSEA is a good free alternative for pathways ( GeneSet enrichment analysis ) GenePattern is a good free alternative to GeneSpring ( www.genepattern.org )
 GenePattern is a good free alternative to GeneSpring ( )")
Similar presentations


 For Tour of GoMiner: Advance using forward arrow.>")


toronen(AT)helsinki.fi.>")
