Download presentation
Presentation is loading. Please wait.

1
Lesson 8.2 Exponential Decay

2
Lesson 8.2 Exponential Decay

3
Lesson 8.2 Exponential Decay

4
Lesson 8.2 Exponential Decay

5
Lesson 8.2 Exponential Decay

6
Lesson 8.2 Exponential Decay

7
Warm-Up Exercises Evaluate the expression without using a calculator. ANSWER 27 ANSWER – 1 1. – 3 3 1 2. 5 2 – 0 3. 4 1 3 2 – 2 + ANSWER 10

8
Warm-Up Exercises ANSWER about 38,238 The population of a town is modeled by where x is the number of years after 1990. What was the population in 1998 ? 4. 12,500 1.15 x = P

9
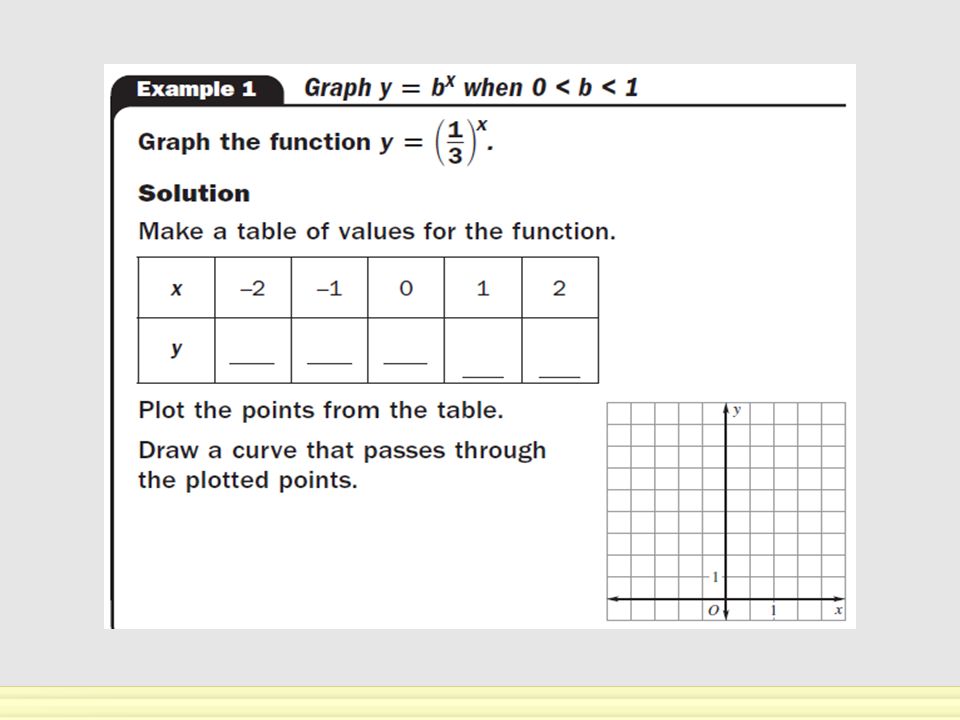
Example 1 Graph when Graph the function. b x y = x y = 1b < 0 < 2 1 Make a table of values for the function. SOLUTION y 0 1 12 x 3 – 2 – 2 1 – 8 4 1 4 2 1

10
Example 1 Plot the points from the table. Draw a curve that passes through the plotted points, as shown. Graph when b x y = 1b < 0 <

11
Example 2 Graph when ab x y = 1b < 0 < Graph the function. a. x y = 2 1 3 b. x y = 3 2 4 1 a. Make a table of values. SOLUTION y 23 3 x 1 – 2 3 01 6 8 3 4 3

12
Example 2 Plot the points. Graph when ab x y = 1b < 0 < Draw a curve that passes through the plotted points, as shown at the right. b. Make a table of values. y 12 x 2 – 1 – 8 3 16 9 4 1 0 6 1 9 1

13
Example 2 Graph when ab x y = 1b < 0 < Plot the points. Draw a curve that passes through the plotted points, as shown at the right.

14
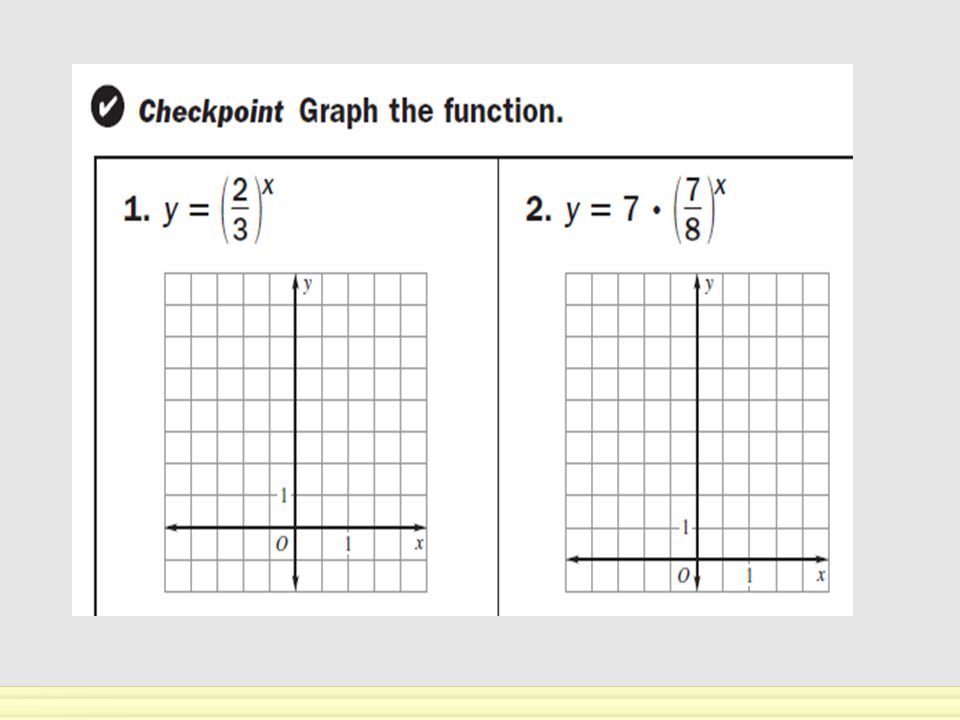
Checkpoint 1. Graph the function. Graph when ab x y = 1b < 0 < x y = 4 1 2. x y = 5 2 ANSWER

15
Checkpoint Graph when ab x y = 1b < 0 < 3. x y = 5 1 2 4. x y = 2 1 10 ANSWER Graph the function. ANSWER

16
Checkpoint Graph when ab x y = 1b < 0 < x y = 3 1 2 1 6. x y = 5 4 5 2 ANSWER Graph the function. ANSWER 5.

17
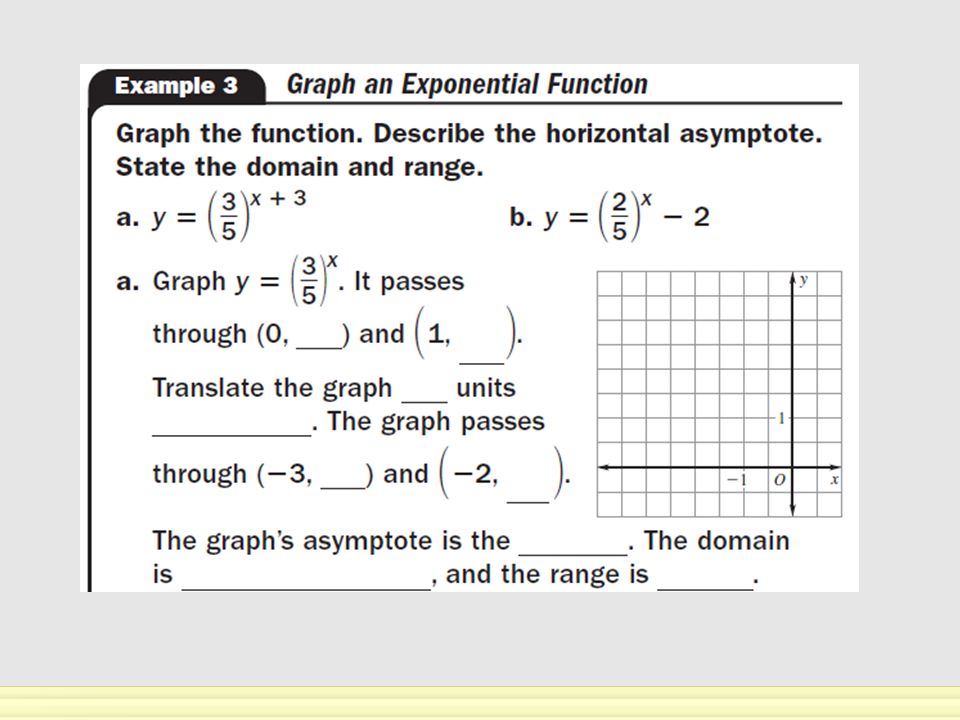
Graph. Describe the horizontal asymptote. State the domain and range. 1 x 2 Example 3 Graph an Exponential Function y = 2 – Translate the graph 2 units to the right. SOLUTION Sketch the graph of the function. It passes through and x y = 2 1 () 0, 1 ( ).). 2, 4 – The graph ’ s asymptote is the x -axis.
 0, 1 ( ).). 2, 4 – The graph ’ s asymptote is the x -axis..")
18
Example 3 Graph an Exponential Function The domain is all real numbers, and the range is 0.0. y >

19
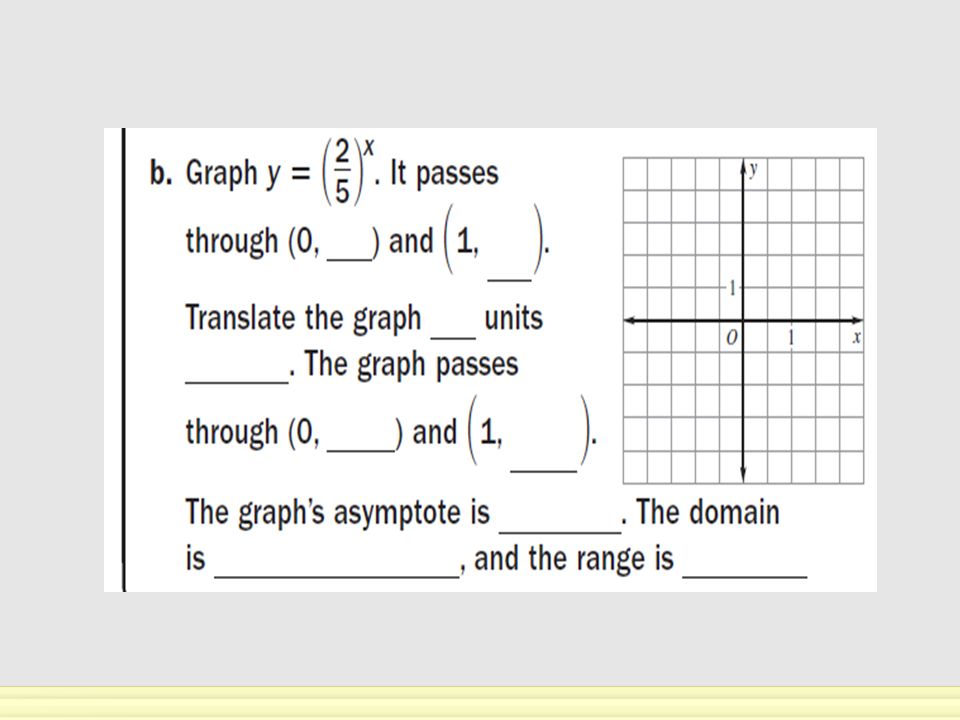
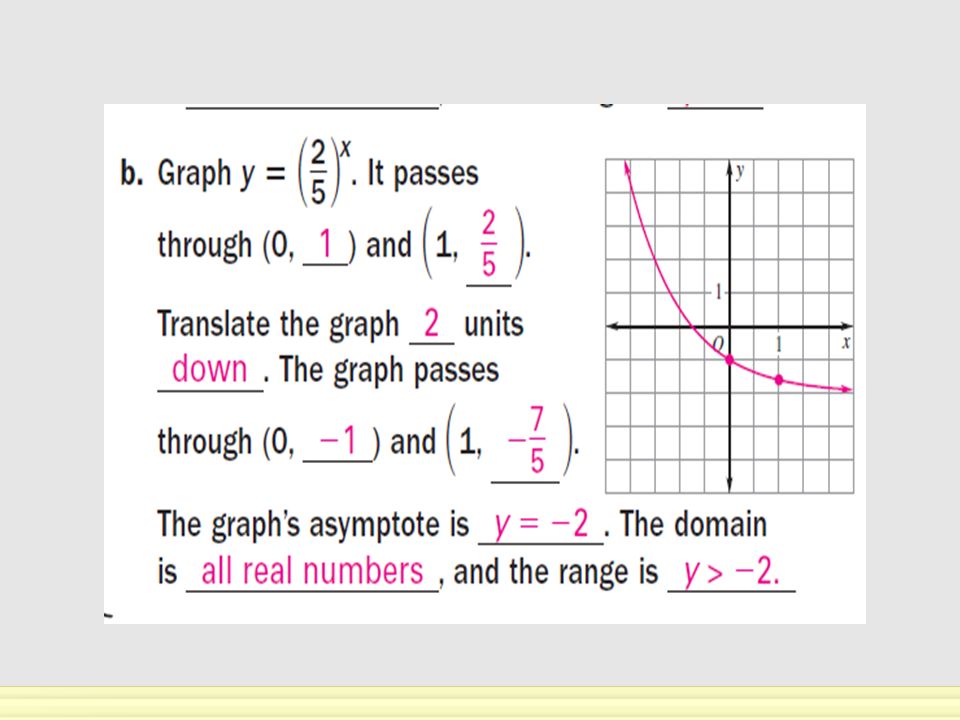
Example 4 Graph an Exponential Function It passes through and. () 0, 1 4 1 2, 2 – Translate the graph 3 units up. It passes through and. () 0, 4 4 1 2, 5 – Sketch the graph of the function. SOLUTION x y = 3 2 Graph Describe the horizontal asymptote. State the domain and range. x y = 3 2 + 3.
 0, , 2 – Translate the graph 3 units up. It passes through and. () 0, , 5 – Sketch the graph of the function. SOLUTION x y = 3 2 Graph Describe the horizontal asymptote. State the domain and range. x y =")
20
Example 4 The graph ’ s asymptote is the line y = 3.3. The domain is all real numbers, and the range is 3.3. y > Graph an Exponential Function

21
Checkpoint 7. Graph the function. Describe the horizontal asymptote. State the domain and range. Graph an Exponential Function y = 2 1 x 3 + ANSWER domain: all real numbers, range: 0y > 0;0; y =

22
Checkpoint Graph the function. Describe the horizontal asymptote. State the domain and range. Graph an Exponential Function y = 4 3 x 5 – ANSWER domain: all real numbers, range: 0y > 0;0; y = 8.

23
Checkpoint Graph the function. Describe the horizontal asymptote. State the domain and range. 9. Graph an Exponential Function x y = 4 1 2 – domain: all real numbers, range: ANSWER 2;2; y = – y > – 2

24
Checkpoint Graph the function. Describe the horizontal asymptote. State the domain and range. 10. Graph an Exponential Function x y = 3 1 + 3 ANSWER domain: all real numbers, range: 3y > 3;3; y =

25
Example 5 Model Exponential Decay Depreciation The value of a used car y (in thousands of dollars) can be approximated by the model where x is the number of years since the car was new. Graph the model. Then use the graph to estimate when the value of the car will be $4000. 20y = ()x)x 0.85 Choose a suitable viewing window. For example, use and 15x ≤≤ 0 25. y ≤≤ 0 You can use a graphing calculator to make a graph. Enter the equation. SOLUTION 20y = ()x)x 0.85
x)x 0.85 Choose a suitable viewing window. For example, use and 15x ≤≤ y ≤≤ 0 You can use a graphing calculator to make a graph. Enter the equation. SOLUTION 20y = ()x)x")
26
Example 5 ANSWER The value of the car will be $4000 after nearly 10 years. Model Exponential Decay The graph passes through,,, and so on. Use the Trace feature to determine that when x is about 10. () 0, 20 () 1, 17 () 2, 14.45 4y =
 0, 20 () 1, 17 () 2, y =.")
27
Checkpoint 11. The value of a van y (in thousands of dollars) can be approximated by the model where x represents the number of years since the van was new. Graph the model. Then use the graph to estimate when the value of the van will be $10,000. Model Exponential Decay 24y = ()x)x 0.9 ANSWER after 8 yr.
 can be approximated by the model where x represents the number of years since the van was new. Graph the model. Then use the graph to estimate when the value of the van will be $10,000. Model Exponential Decay 24y = ()x)x 0.9 ANSWER after 8 yr..")
Similar presentations

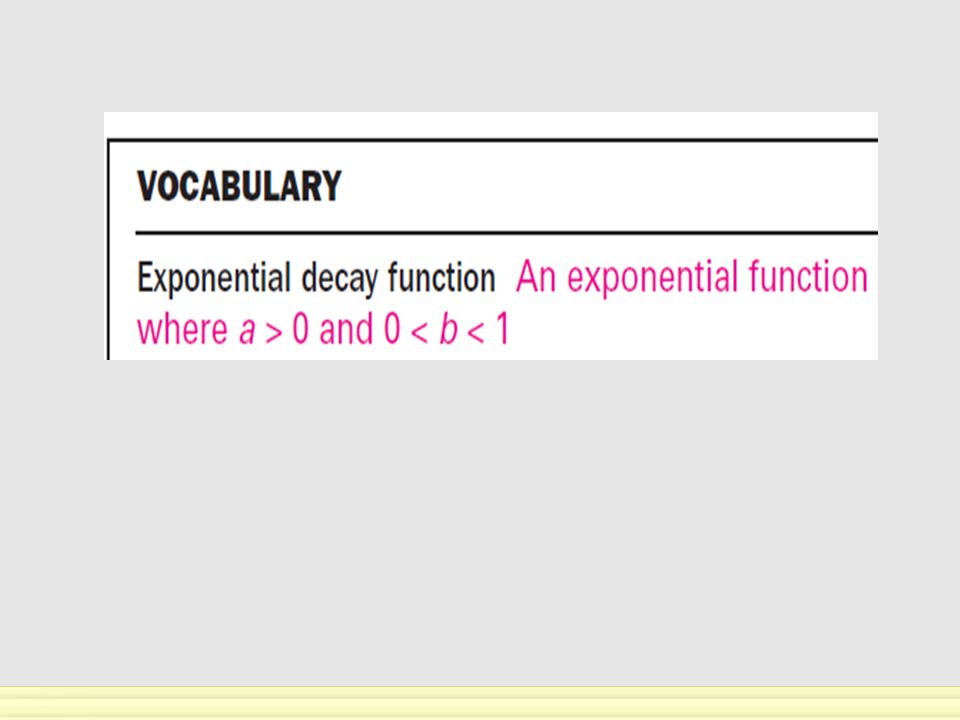


 = ab x Where a > 0 BUT: 0 < b < 1 (a fraction between 0 & 1)>")

 = √x. y = 3√x – 1 y = -1/2√x y = - √(x-1) + 2.>")


 4.4-4.5 Quiz: Friday Computer Lab (C28): Monday **You need graph paper**>")

