Download presentation
Presentation is loading. Please wait.

1
Auditory Evoked Potential (AEP)Testing
Lecture 11

2
Outline Principles/Background Purpose/Features View video
Clinical application/limitations ABR Interpretations Threshold Differential Diagnosis Other Evoked Potentials

3
Underlying Principles
Normal auditory system Transmit acoustic stimuli into an electrical response Stimulus – triggers “Action Potentials” Response to the stimulus is extremely small Repeated stimuli –response patterns “averaged” over time result in a robust tracing that’s observed

5
Background Computerized test of hearing (cochlear) and auditory nerve (neurological) functioning Used in evaluation of: Hearing Integrity Neurologic Integrity First application 1971(Jewett and Williston) Hundreds of published clinical studies on applications Does not provide info about cortical areas
 Hundreds of published clinical studies on applications. Does not provide info about cortical areas.")
6
Purpose To convert acoustic stimuli into electrical stimuli and measure associated brain wave activity Brain wave activity is monitored by measuring computer-averaged changes in EEG activity Electrical responses recorded from the scalp in response to an auditory stimulus Time that it takes for sounds to travel can be measured on the acquired waveforms

7
Features Objective test Noninvasive Ear specific
BAER. BSER, BAEP,ABR Noninvasive Ear specific Performed in quiet or sleep state Performed with AC and/or BC Performed with frequency specific stimuli

8
Clinical Application of evoked potential testing
Differential diagnosis (cochlear and retrocochlear) Screening procedure for newborns Diagnostic tool to ID HL in infants and children Estimate hearing in difficult to test population Intra-operative monitoring Prognostic indicator with head trauma
 Screening procedure for newborns. Diagnostic tool to ID HL in infants and children. Estimate hearing in difficult to test population. Intra-operative monitoring. Prognostic indicator with head trauma.")
10
Generator sites of ABR Major peaks in waveforms: labeled by Roman numerals I-V Response originates in the VIIIth cranial nerve Wave I: VIII distal Wave II: CN Wave III: SOC Wave IV: LL Wave V: IC

11
Generator Sites Without exception, every anatomical structure on one side of the brain has an identical structure on the opposite side.

12
Synchronous activation
Reflects synchronous activation (onset type neurons)
")
13
Synchronous activation

14
Frequency range of ABR response
Response dependent on activation of basilar region of the cochlea in response to click (2K-4K)
")
15
Stimulus Click: brief duration signal, broad band signal ______through AC headphones Tone burst : provides more frequency specific info Rate of stimulus: _______/sec Intensity : Start w high intensity and decrease Lowest level at which a repeatable waveform observed (of wave _______) is called threshold
 is called threshold.")
16
Preparation Application of recording electrodes Placement of earphones
Vertex Forehead Earlobe/mastoid Placement of earphones Patient lying still or asleep 30 minutes or longer

17
Electrode Set up

19
ABR clinical measures (time)
Two Metrics Inter-wave Interval Absolute latency value of wave

20
ABR clinical Measures (intensity)
One Metric Absolute threshold

21
Factors that influence ABR
Age of subject (<18 mos., >60 yrs) Longer latency values for older and younger clients Gender Not affected by most drugs (including sedatives) Movement Temperature
 Longer latency values for older and younger clients. Gender. Not affected by most drugs (including sedatives) Movement. Temperature.")
22
Clinical limitations Frequency range Hz, most important to ABR Does not estimate hearing levels in lower frequency ranges ABR is NOT a test of hearing Response provides no information on the auditory system above the brainstem level

23
ABR mostly reflects higher freq hearing

24
Normal Hearing: Wave V threshold @ 20 dB: Suggests normal hearing
I-V interval

25
ABR used to determine cochlear function
II III IV V Lower intensity associated with increased latency values Try to ID the dB HL level where you still observe Wave V V V V

26
Threshold ABR - Moderate HL
Wave V responses observed down to 55 dB HL Results suggest a possible moderate hearing loss

27
Threshold ABR: Severe HL
What is threshold?

28
ABR to determine function of VIIIth nerve
Multiple Sclerosis VIII nerve tumors Meniere’s Disease Auditory Neuropathy Calculate Interwave Interval

29
Calculate IWI Hearing: WNL Right sided tinnitus
Intolerance to loud sounds

30
Acoustic Neuroma

31
Reporting results of ABR

32
What would ABR look like?

33
Differential Diagnosis

34
Examples of Differential Diagnosis

35
Screening ABR Prevalence of HL NICU: .5-5% Well baby <1%
Conducted on newborns prior to discharge Test at 2 levels: 60 dB HL and 30 dB HL Factors influencing outcome: Neurologic abnormalities Poor health Transient conductive problems Muscle artifact Collapsing canals Earphone placement

36
Screening ABR 60 dB HL 30 dB HL

37
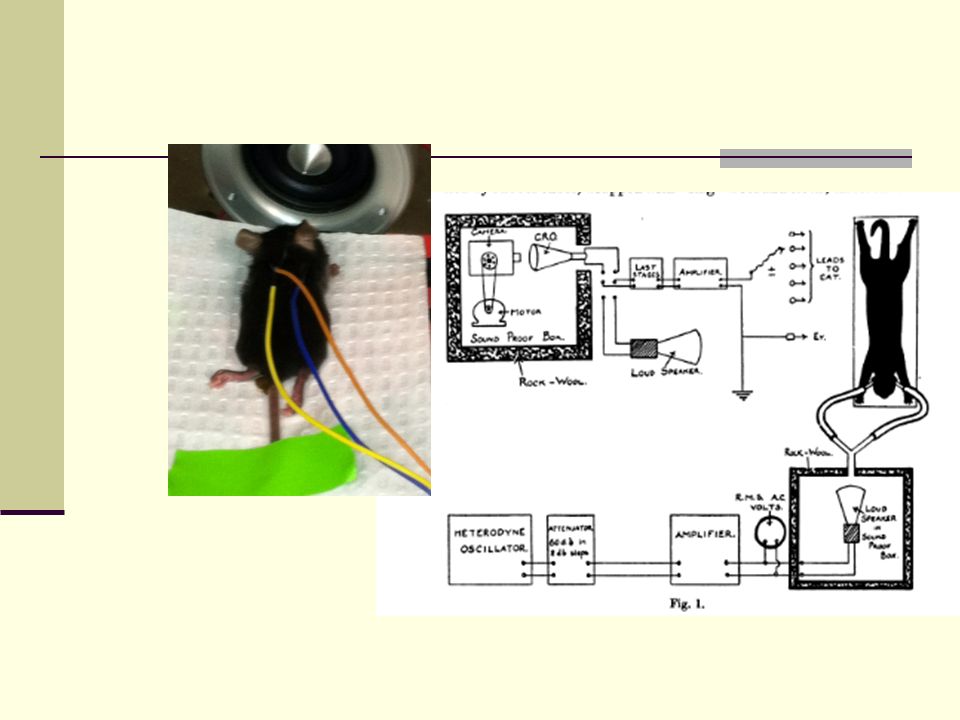
Cochlear Microphonic (CM) (Wever and Bray, 1930)
Summary of classic research Electrode in the auditory nerve of a cat Speech through loudspeaker The resulting electrical activity when transduced back to sound (thru a telephone receiver) and amplified, was transmitted as clear speech Pure tones were reproduced accurately as well up to 3000 Hz.
 and amplified, was transmitted as clear speech. Pure tones were reproduced accurately as well up to 3000 Hz.")
39
CM defined An electrical response from the cochlea reflects a combination of IHC and OHC function in response to acoustic stimulation CM Mimics the form of the sound pressure waves that arrive at the ear … (aka a “stimulus following response” Reverses in phase with changes in the stimulus polarity from rarefaction (-)to condensation (+)(Ferraro & Krishnan, 1997). looks like the waves "flip" or invert
to condensation (+)(Ferraro & Krishnan, 1997). looks like the waves flip or invert.")
40
Cochlear Microphonic in AN
AN is defined as absent or severely distorted ABR with preserved OAE’s and cochlear microphonics CM “reverses or flips” when the stimulus reverses polarity (from + to -) Can only be seen if ABR done with both + and – polarity
 Can only be seen if ABR done with both + and – polarity.")
41
Other Auditory Evoked Responses
Middle Latency Response (MLR) Auditory Late Response (ALR)
 Auditory Late Response (ALR)")
42
MLR Documentation of CNS dysfunction above brainstem through thalamus
estimation of auditory sensitivity in older children / adults (malingerers) State of arousal
 State of arousal.")
43
ALR Assesses higher cortical processing from A1 and A2 areas
P300 – information processing Latencies slow with age Auditory processing

44
Calculate Interwave intervals

Similar presentations


>")
 DR.S.H.HASHEMI 1.>")


 Reliability vs. validity.>")


