Download presentation
Presentation is loading. Please wait.

1
Surface-based Group Analysis in FreeSurfer

2
Outline Processing Stages Command-line Stream Assemble Data
Design/Contrast (GLM Theory) Analyze Visualize Interactive/Automated GUI (QDEC) Correction for multiple comparisons
 Analyze. Visualize. Interactive/Automated GUI (QDEC) Correction for multiple comparisons.")
3
Surface-based Study (Thickness)
")
4
Surface-based Measures
Morphometric (eg, thickness) Functional PET MEG/EEG Diffusion (?) sampled just under the surface
 Functional. PET. MEG/EEG. Diffusion ( ) sampled just under the surface.")
5
Processing Stages Specify Subjects and Surface measures Assemble Data:
Resample into Common Space Smooth Concatenate into one file Model and Contrasts (GLM) Fit Model (Estimate) Correct for multiple comparisons Visualize
 Fit Model (Estimate) Correct for multiple comparisons. Visualize.")
6
Intersubject Registration

7
Volumetric Interesubject Registration (Affine)
3D Coordinate System XYZ, RAS MR Intensity Affine/Linear Translate Rotate Stretch Shear (12 DOF) Match Intensity, Voxel-by-Voxel Problems Can use nonlinear volumetric (cf CVS)
 Match Intensity, Voxel-by-Voxel. Problems. Can use nonlinear volumetric (cf CVS)")
8
Surface-based Intersubject Registration
inflated pial Curvature SULCUS (+) GYRUS (-) Sheet: 2D Coordinate System (X,Y) Sphere: 2D Coordinate System (q,f) Continuous, no cuts superior temporal calcarine central sylvian anterior posterior
 GYRUS (-) Sheet: 2D Coordinate System (X,Y) Sphere: 2D Coordinate System (q,f) Continuous, no cuts. superior temporal. calcarine. central. sylvian. anterior. posterior.")
9
Surface-based Intersubject Registration
Curvature “Intensity” SULCUS (+) GYRUS (-) Codes folding pattern Translate, Rotate, Stretch, Shear (12 DOF) Match Curvature, Vertex-by-Vertex Nonlinear Stretching (“Morphing”) allowed (area regularization) Actually done on sphere “Spherical Morph”
 GYRUS (-) Codes folding pattern. Translate, Rotate, Stretch, Shear (12 DOF) Match Curvature, Vertex-by-Vertex. Nonlinear Stretching ( Morphing ) allowed (area regularization) Actually done on sphere. Spherical Morph")
10
Surface-based Intersubject Registration
Gray Matter-to-Gray Matter (it’s all gray matter!) Gyrus-to-Gyrus and Sulcus-to-Sulcus Some minor folding patterns won’t line up Fully automated, no landmarking needed Atlas registration is probabilistic, most variable regions get less weight. Done in recon-all
 Gyrus-to-Gyrus and Sulcus-to-Sulcus. Some minor folding patterns won’t line up. Fully automated, no landmarking needed. Atlas registration is probabilistic, most variable regions get less weight. Done in recon-all.")
11
Spatial Smoothing Why should you smooth? Might Improve CNR
Improve intersubject registration (functional) How much smoothing? Blob-size Typically mm FWHM Surface smoothing more forgiving than volume-based
 How much smoothing Blob-size. Typically mm FWHM. Surface smoothing more forgiving than volume-based.")
12
Volume-based Smoothing
7mm FWHM 14mm FWHM Smoothing is averaging of nearby voxels

13
Volume-based Smoothing
14mm FWHM 5 mm apart in 3D 25 mm apart on surface! Kernel much larger Averaging with other tissue types (WM, CSF) Averaging with other functional areas
 Averaging with other functional areas.")
14
Surface-based Smoothing
Smoothing is averaging of nearby vertices Sheet: 2D Coordinate System (X,Y) Sphere: 2D Coordinate System (q,f) superior temporal calcarine central sylvian anterior posterior
 Sphere: 2D Coordinate System (q,f) superior temporal. calcarine. central. sylvian. anterior. posterior.")
15
The General Linear Model (GLM)
")
16
GLM Theory Is Thickness correlated with Age? Thickness x1 x2 y2 y1
Dependent Variable, Measurement Subject 1 Subject 2 HRF Amplitude IQ, Height, Weight Age Of course, you’d need more then two subjects … Independent Variable

17
System of Linear Equations
Linear Model Intercept: b Slope: m Thickness Age x1 x2 y2 y1 System of Linear Equations y1 = 1*b + x1*m y2 = 1*b + x2*m y1 y2 1 x1 1 x2 b m = * Matrix Formulation Intercept = Offset X = Design Matrix b = Regression Coefficients = Parameter estimates = “betas” = Intercepts and Slopes = beta.mgh (mri_glmfit) b m b= Y = X*b mri_glmfit output: beta.mgh
 b. m. b= Y = X*b. mri_glmfit output: beta.mgh.")
18
Hypotheses and Contrasts
Is Thickness correlated with Age? Does m = 0? Null Hypothesis: H0: m=0 y1 y2 1 x1 1 x2 b m = * m= [0 1]* b m Intercept: b Slope: m Thickness Age x1 x2 y2 y1 b m b= g = C*b = 0 ? C=[0 1]: Contrast Matrix mri_glmfit output: gamma.mgh

19
More than Two Data Points
Thickness Intercept: b y1 y2 y3 y4 1 x1 1 x2 1 x3 1 x4 b m = * Slope: m Age Y = X*b y1 = 1*b + x1*m y2 = 1*b + x2*m y3 = 1*b + x3*m y4 = 1*b + x4*m Model Error Noise Uncertainty rvar.mgh No matter how many data points you have, there is still only one slope and one intercept.

20
t-Test and p-values g = C*b Y = X*b p-value/significance
value between 0 and 1 closer to 0 means more significant FreeSurfer stores p-values as –log10(p): 0.1=10-1sig=1, 0.01=10-2sig=2 sig.mgh files Signed by sign of g p-value is for an unsigned test
: 0.1=10-1sig=1, 0.01=10-2sig=2. sig.mgh files. Signed by sign of g. p-value is for an unsigned test.")
21
Two Groups Do groups differ in Intercept? Do groups differ in Slope?
Intercept: b1 Slope: m1 Thickness Age Intercept: b2 Slope: m2 Is average slope different than 0? …

22
Two Groups Y = X*b * = y11 = 1*b1 + 0*b2 + x11*m1 + 0*m2
Intercept: b1 Slope: m1 Thickness Age Intercept: b2 Slope: m2 y11 y12 y21 y22 x11 0 x12 0 x21 x22 b1 b2 m1 m2 = * Y = X*b y11 = 1*b1 + 0*b2 + x11*m *m2 y12 = 1*b1 + 0*b2 + x12*m *m2 y21 = 0*b1 + 1*b *m1 + x21*m2 y22 = 0*b1 + 1*b *m1 + x22*m2

23
Two Groups Y = X*b b = * = y11 1 0 x11 0 y12 1 0 x12 0 y21 0 1 0 x21
m1 m2 y11 y12 y21 y22 x11 0 x12 0 x21 x22 * Do groups differ in Intercept? Does b1=b2? Does b1-b2 = 0? C = [ ], g = C*b = Do groups differ in Slope? Does m1=m2? Does m1-m2=0? C = [ ], g = C*b b1 b2 m1 m2 Y = X*b b = Intercept: b1 Slope: m1 Thickness Age Intercept: b2 Slope: m2 Is average slope different than 0? Does (m1+m2)/2 = 0? C = [ ], g = C*b
/2 = 0 C = [ ], g = C*b.")
24
Surface-based Group Analysis in FreeSurfer
Create your own design matrix and contrast matrices Create an FSGD File FreeSurfer creates design matrix You still have to specify contrasts QDEC Limited to 2 discrete variables, 2 levels max Limited to 2 continuous variables

25
Command-line Processing Stages
Assemble Data (mris_preproc) Resample into Common Space Smooth Concatenate into one file Model and Contrasts (GLM) (FSGD) Fit Model (Estimate) (mri_glmfit) Correct for multiple comparisons Visualize (tksurfer) } recon-all -qcache
 Resample into Common Space. Smooth. Concatenate into one file. Model and Contrasts (GLM) (FSGD) Fit Model (Estimate) (mri_glmfit) Correct for multiple comparisons. Visualize (tksurfer) } recon-all -qcache.")
26
Specifying Subjects $SUBJECTS_DIR fred jenny margaret … bert
Subject ID $SUBJECTS_DIR fred jenny margaret … bert Set SUBJECTS_DIR, issue a command (mksubjdirs) to create directory structure. Convert (using mri_convert) data to COR format and store in mri/RRR, run recon-all. Typically, we acquire 3 high-quality T1 volumes to use as input to reconstruction (128-slice sagital, 1 mm in-plane resolution).
 to create directory structure. Convert (using mri_convert) data to COR format and store in mri/RRR, run recon-all. Typically, we acquire 3 high-quality T1 volumes to use as input to reconstruction (128-slice sagital, 1 mm in-plane resolution).")
27
FreeSurfer Directory Tree
Subject ID bert bem stats morph mri rgb scripts surf tiff label orig T1 brain wm aseg lh.aparc_annnot rh.aparc_annnot Set SUBJECTS_DIR, issue a command (mksubjdirs) to create directory structure. Convert (using mri_convert) data to COR format and store in mri/RRR, run recon-all. Typically, we acquire 3 high-quality T1 volumes to use as input to reconstruction (128-slice sagital, 1 mm in-plane resolution). lh.white rh.white lh.thickness rh.thickness lh.sphere.reg rh.sphere.reg SUBJECTS_DIR environment variable
 to create directory structure. Convert (using mri_convert) data to COR format and store in mri/RRR, run recon-all. Typically, we acquire 3 high-quality T1 volumes to use as input to reconstruction (128-slice sagital, 1 mm in-plane resolution). lh.white. rh.white. lh.thickness. rh.thickness. lh.sphere.reg. rh.sphere.reg. SUBJECTS_DIR environment variable.")
28
Example: Thickness Study
$SUBJECTS_DIR/bert/surf/lh.thickness $SUBJECTS_DIR/fred/surf/lh.thickness $SUBJECTS_DIR/jenny/surf/lh.thickness $SUBJECTS_DIR/margaret/surf/lh.thickness …

29
FreeSurfer Group Descriptor (FSGD) File
Simple text file List of all subjects in the study Accompanying demographics Automatic design matrix creation You must still specify the contrast matrices Integrated with tksurfer Note: Can specify design matrix explicitly with --design

30
FSGD Format GroupDescriptorFile 1 Class Male Class Female
Variables Age Weight IQ Input bert Male Input fred Male Input jenny Female Input margaret Female One Discrete Factor (Gender) with Two Levels (M&F) Three Continuous Variables: Age, Weight, IQ Class = Group Note: Can specify design matrix explicitly with --design
 with Two Levels (M&F) Three Continuous Variables: Age, Weight, IQ. Class = Group. Note: Can specify design matrix explicitly with --design.")
31
} FSGDF X (Automatic) } X = C = [-1 1 0 0 0 0 0 0]
X = Male Group Female Group Female Age Male Age Weight Age IQ C = [ ] } Tests for the difference in intercept/offset between groups C = [ ] } Tests for the difference in age slope between groups DODS – Different Offset, Different Slope
![} FSGDF X (Automatic) } X = C = [ ]](http://slideplayer.com/slide/10709851/37/images/31/%7D+FSGDF+%EF%83%A0+X+%28Automatic%29+%7D+X+%3D+C+%3D+%5B+%5D.jpg "X = Male Group. Female Group. Female Age. Male Age. Weight. Age. IQ. C = [ ] } Tests for the difference in intercept/offset between groups. C = [ ] } Tests for the difference in age slope between groups. DODS – Different Offset, Different Slope.")
32
Factors, Levels, Groups Each Group/Class: Has its own Intercept
Has its own Slope (for each continuous variable) NRegressors = NClasses*(NVariables+1)
 NRegressors = NClasses*(NVariables+1)")
33
Factors, Levels, Groups, Classes
Continuous Variables/Factors: Age, IQ, Volume, etc Discrete Variables/Factors: Gender, Handedness, Diagnosis Levels of Discrete : Handedness: Left and Right Gender: Male and Female Diagnosis: Normal, MCI, AD Group or Class: Specification of All Discrete Factors: Left-handed Male MCI Right-handed Female Normal

34
Assemble Data: mris_preproc
mris_preproc --help --fsgd FSGDFile : Specify subjects thru FSGD File --hemi lh : Process left hemisphere --meas thickness : $SUBJECTS_DIR/subjectid/surf/hemi.thickness --target fsaverage : common space is subject fsaverage --o lh.thickness.mgh : output “volume-encoded surface file” Lots of other options! lh.thickness.mgh – file with thickness maps for all subjects Input to Smoother or GLM

35
Surface Smoothing mri_surf2surf --help Loads lh.thickness.mgh
2D surface-based smoothing Specify FWHM (eg, fwhm = 10 mm) Saves lh.thickness.sm10.mgh Can be slow (~10-60min) recon-all -qcache
 Saves lh.thickness.sm10.mgh. Can be slow (~10-60min) recon-all -qcache.")
36
mri_glmfit Reads in FSGD File and constructs X
Reads in your contrasts (C1, C2, etc) Loads data (lh.thickness.sm10.mgh) Fits GLM (ie, computes b) Computes contrasts (g=C*b) t or F ratios, significances Significance -log10(p) (.01 2, .001 3)
 Loads data (lh.thickness.sm10.mgh) Fits GLM (ie, computes b) Computes contrasts (g=C*b) t or F ratios, significances. Significance -log10(p) (.01 2, .001 3)")
37
mri_glmfit mri_glmfit --y lh.thickness.sm10.mgh --fsgd gender_age.txt
--C age.mat –C gender.mat --surf fsaverage lh --cortex --glmdir lh.gender_age.glmdir Creates: lh.gender_age.glmdir/ beta.mgh – parameter estimates rvar.mgh – residual error variance etc … age/ sig.mgh – -log10(p), uncorrected gamma.mgh, F.mgh gender/ sig.mgh – -log10(p) mri_glmfit --help
, uncorrected. gamma.mgh, F.mgh. gender/ sig.mgh – -log10(p) mri_glmfit --help.")
38
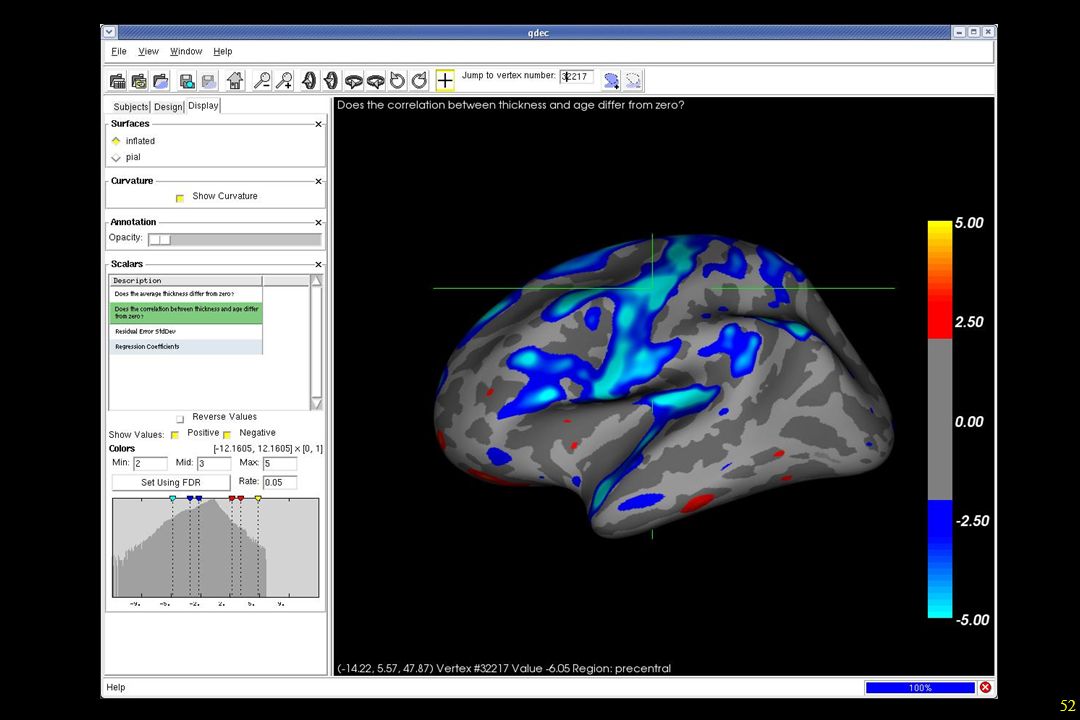
Visualization with tksurfer
Saturation: -log10(p), Eg, 5=.00001 Threshold: -log10(p), Eg, 2=.01 False Dicovery Rate Eg, .01 View->Configure->Overlay File->LoadOverlay
, Eg, 5= Threshold: -log10(p), Eg, 2=.01. False. Dicovery. Rate. Eg, .01. View->Configure->Overlay. File->LoadOverlay.")
39
Visualization with tksurfer
File-> Load Group Descriptor File …

40
Problem of Multiple Comparisons

41
Correction for Multiple Comparisons
Cluster-based Monte Carlo simulation Permutation Tests Surface Gaussian Random Fields (GRF) There but not fully tested False Discovery Rate (FDR) – built into tksurfer and QDEC. (Genovese, et al, NI 2002)
 There but not fully tested. False Discovery Rate (FDR) – built into tksurfer and QDEC. (Genovese, et al, NI 2002)")
42
Clustering Choose a vertex-wise threshold
Eg, 2 (p<.01), or 3 (p<.001) Sign (pos, neg, abs) A cluster is a group of connected (neighboring) vertices above threshold Cluster has a size (area in mm2) p<.01 (-log10(p)=2) Negative p<.0001 (-log10(p)=4) Negative
, or 3 (p<.001) Sign (pos, neg, abs) A cluster is a group of connected (neighboring) vertices above threshold. Cluster has a size (area in mm2) p<.01 (-log10(p)=2) Negative. p<.0001 (-log10(p)=4) Negative.")
43
Cluster-based Correction for Multiple Comparisons
Simulate data under Null Hypothesis: Synthesize Gaussian noise and then smooth (Monte Carlo) Permute rows of design matrix (Permutation, orthog) Analyze, threshold, cluster, max cluster size Repeat 10,000 times Analyze real data, get cluster sizes P(cluster) = #MaxClusterSize > ClusterSize/10000 mri_glmfit-sim
 Permute rows of design matrix (Permutation, orthog) Analyze, threshold, cluster, max cluster size. Repeat 10,000 times. Analyze real data, get cluster sizes. P(cluster) = #MaxClusterSize > ClusterSize/ mri_glmfit-sim.")
44
QDEC – An Interactive Statistical Engine GUI
Query – Select subjects based on Match Criteria Design – Specify discrete and continuous factors Estimate – Fit Model Contrast – Automatically Generate Contrast Matrices Interactive – Makes easy things easy (that used to be hard) …a work in progress No Query yet Two Discrete Factors (Two Levels) Two Continuous Factors Surface only
 …a work in progress. No Query yet. Two Discrete Factors (Two Levels) Two Continuous Factors. Surface only.")
45
QDEC – Spreadsheet qdec.table.dat – spreadsheet with subject information – spreadsheet can be huge! fsid gender age diagnosis Left-Cerebral-White-Matter-Vol 011121_vc Female Demented 021121_ Female Demented 010607_vc Female Nondemented 021121_vc Male Demented 020718_ Male Demented 020322_vc Male Nondemented gender.levels diagnosis.levels Discrete Factors need a factorname.level file Female Male Demented Nondemented

46
Tutorial Command-line Stream QDEC – same data set
Create an FSGD File for a thickness study Age and Gender Run mris_preproc mri_surf2surf mri_glmfit mri_glmfit-sim tksurfer QDEC – same data set

48
Another FSGD Example Two Discrete Factors One Continuous Variable: Age
Gender: Two Levels (M&F) Handedness: Two Levels (L&R) One Continuous Variable: Age GroupDescriptorFile 1 Class MaleRight Class MaleLeft Class FemaleRight Class FemaleLeft Variables Age Input bert MaleLeft Input fred MaleRight Input jenny FemaleRight Input margaret FemaleLeft Class = Group
 Handedness: Two Levels (L&R) One Continuous Variable: Age. GroupDescriptorFile 1. Class MaleRight. Class MaleLeft. Class FemaleRight. Class FemaleLeft. Variables Age. Input bert MaleLeft 10. Input fred MaleRight 15. Input jenny FemaleRight 20. Input margaret FemaleLeft 25. Class = Group.")
49
Interaction Contrast g = D1 -D2=0 g = (b3-b1)- (b4-b2) = -b1+b2+ b3-b4
Two Discrete Factors (no continuous, for now) Gender: Two Levels (M&F) Handedness: Two Levels (L&R) Four Regressors (Offsets) MR (b1), ML (b2), FR (b3), FL (b4) M F R L b1 b4 b3 b2 D1 D2 GroupDescriptorFile 1 Class MaleRight Class MaleLeft Class FemaleRight Class FemaleLeft Input bert MaleLeft Input fred MaleRight Input jenny FemaleRight Input margaret FemaleLeft g = D1 -D2=0 g = (b3-b1)- (b4-b2) = -b1+b2+ b3-b4 C = [ ] ?
 Gender: Two Levels (M&F) Handedness: Two Levels (L&R) Four Regressors (Offsets) MR (b1), ML (b2), FR (b3), FL (b4) M. F. R. L. b1. b4. b3. b2. D1. D2. GroupDescriptorFile 1. Class MaleRight. Class MaleLeft. Class FemaleRight. Class FemaleLeft. Input bert MaleLeft. Input fred MaleRight. Input jenny FemaleRight. Input margaret FemaleLeft. g = D1 -D2=0. g = (b3-b1)- (b4-b2) = -b1+b2+ b3-b4. C = [ ]")
50
QDEC GUI Load QDEC Table File List of Subjects
List of Factors (Discrete and Cont) Choose Factors Choose Input (cached): Hemisphere Measure (eg, thickness) Smoothing Level “Analyze” Builds Design Matrix Builds Contrast Matrices Constructs Human-Readable Questions Analyzes Displays Results
 Choose Factors. Choose Input (cached): Hemisphere. Measure (eg, thickness) Smoothing Level. Analyze Builds Design Matrix. Builds Contrast Matrices. Constructs Human-Readable Questions. Analyzes. Displays Results.")
51
.

53
FSGDF X X = C = [-1 1 0 0 0] Input: y X C 1 0 10 100 1000
DOSS – Different Offset, Same Slope Female Class Age for Males and Females Male Class X = . C = [ ] Same test, different vector #Regressors = Nv+Nc = 3+2=5 Fewer regressors than DODS DOF = #Rows - #Regressors
![FSGDF X X = C = [ ] Input: y X C](http://slideplayer.com/slide/10709851/37/images/53/FSGDF+%EF%83%A0X+X+%3D+C+%3D+%5B+%5D+Input%3A+y+X+C.jpg "DOSS – Different Offset, Same Slope. Female Class. Age for Males and Females. Male Class X = . C = [ ] Same test, different vector. #Regressors = Nv+Nc = 3+2=5 Fewer regressors than DODS. DOF = #Rows - #Regressors.")
Similar presentations


 Registration FS workshop Gheorghe Postelnicu, Lilla Zöllei, Bruce Fischl A.A. Martinos Center for Biomedical Imaging,>")


 Institute for Empirical.>")


