Download presentation
Presentation is loading. Please wait.

2
Sand Point Section

3
Oceanport Facts Population 5832 21.0% from 25 to 44 32.8% from 45 to 64 16.1% who were 65 years of age or older. The median age was 44.4 years. 37% increase in population between now and 2040 Size 3.2 Square Miles Additional 419 acres with Fort Monmouth Waterfront 9.50 miles Median household income was $89,208 2,390 housing units

4
SANDY Homes Lifted- 84- applied, in progress or completed Expect more with grant process Demos- 32 New Construction- 24 Substantial damaged- 120 Homes affected estimate 1200

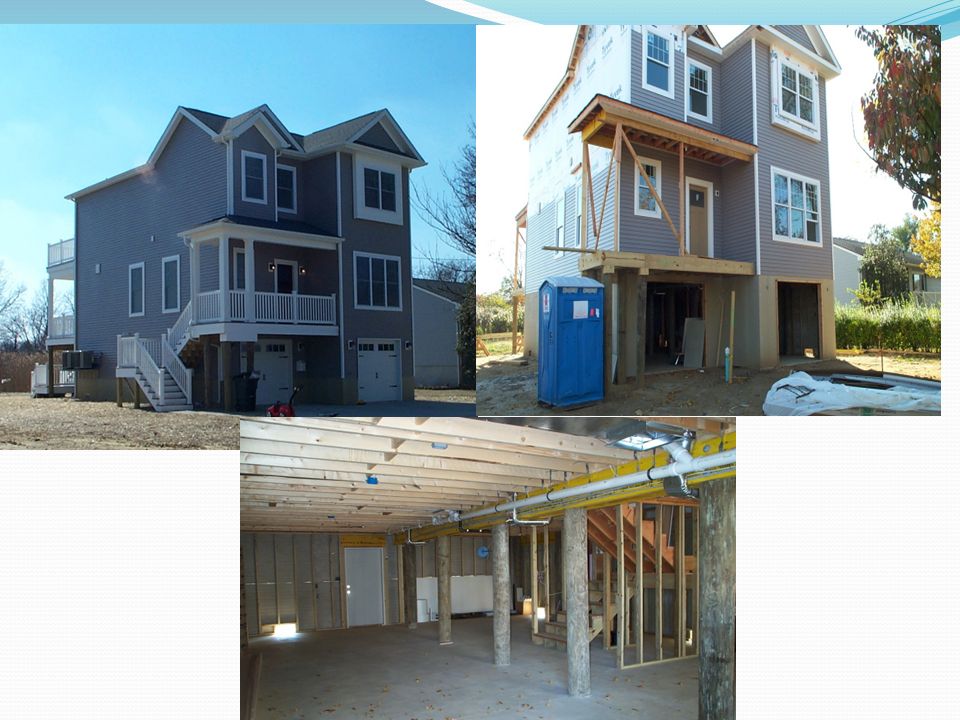
5
Lifting-January 2013 Finished- March 2013

7
Boro Hall- Oceanport

8
Flooding

11
Monmouth Park Race Track Parking Lot- 2000 cars

14
Flooding levels

15
Boat yard

17
Tent City- Monmouth Park

23
Shelter- Maple Place School doing about 425 meals daily-7days

Similar presentations


 Week April 1-6, 2013.>")


