Download presentation
Presentation is loading. Please wait.

1
Diabetes Disparities in Washington State: Exploring Changes Over Time Presentation to the Washington State Diabetes Leadership Team Marilyn Sitaker July, 2010

2
CDPU Disparities Analysis For a number of chronic diseases and their risk factors, we wanted to know: 1.How big are current disparities? 2.How have disparities changed over time? 3.How many people are affected? 4.How do neighborhood sociodemographic factors affect risk of diabetes? 5.Which areas across the state have the highest risk of chronic diseases and their risk factors? We used BRFSS data to examine disparities by educational attainment, income and race/ethnicity This presentation focuses on diabetes and its risk factor, obesity

3
Measuring Diabetes Disparities according to Household Income Absolute measures compare the difference in risk between the highest and lowest group: 11.4 – 4.5 = 6.9% Relative measures use a ratio or risk in the highest & lowest income groups: 11.4 ÷ 4.5 = 2.5 Relative measures help you compare health conditions of different magnitudes

4
DiabetesObesity Disparities by Income, Washington, 2006-2008

5
How many people are affected? *based on 2006-2008 prevalences

6
Trends in Obesity, by Education

7
Trends in Diabetes by Education

8
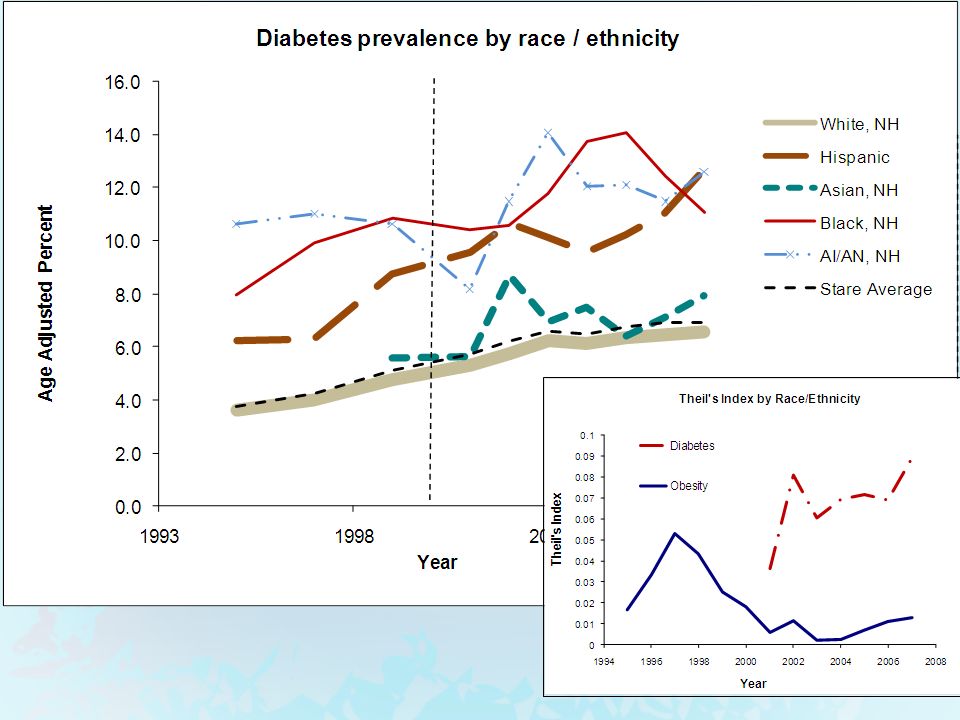
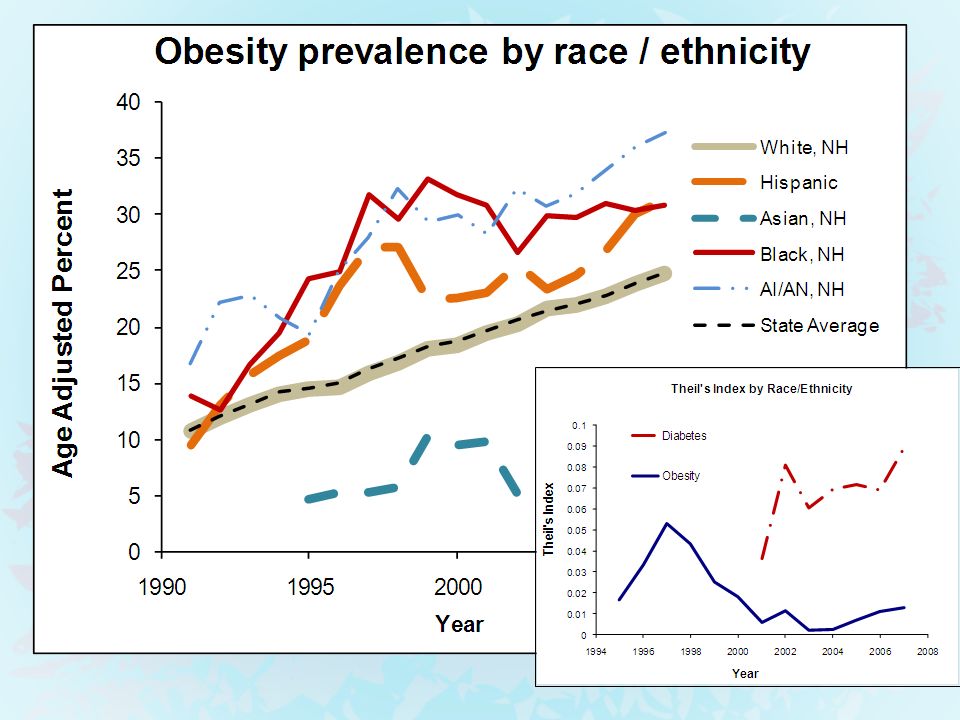
Disparities by Race/ethnicity Racial groups comprise unequal shares of the population Race = socially defined groups based on outward appearance— there’s no inherent “ranking” Race is not merely a proxy for SES Disparities by “race” reflect racism, not inherent biology

9
5 year averages3 year averages

10
What are we looking for? 1.What do we mean by fair? Fair = burden of poor health is shared equally among groups, proportional to population size. 2. What improvements do we hope to detect? By what means do we hope to decrease disparity?

11
Concepts of Fairness Health is a finite resource; share the burden equally Disparity is reduced partly because the healthy group gives up some of their good health No one should be left behind. All have a right to the best health possible. Disparity reduced because sick people become healthier.

12
Our summary measure of racial/ethnic disparities matches our values

16
Impact of Individual & Area-Based Factors Area Based Factors (Census) Income Median household income Education Percent with college degree Wealth Median home value Individual Factors (BRFSS) Age Income Education Race / Ethnicity How do neighborhood socio economic factors impact the risk of diabetes predicted by, if we control for individual factors ?
 Income Median household income Education Percent with college degree Wealth Median home value Individual Factors (BRFSS) Age Income Education Race / Ethnicity How do neighborhood socio economic factors impact the risk of diabetes predicted by, if we control for individual factors")
17
Diabetes Models (Neighborhood factors at ZIP-Code Level) Diabetes Coefficient (b)P % College Education-0.005520.011 Median Home Value-1.40E-060.001 % Receiving Public Assistance0.029420.000 Intercept-2.7010.000 Note: For the diabetes model, individual age is treated as a continuous covariate. Odds Ratios by ZIP Code: Min = 0.28Avg = 1.01 Max = 2.16SD = 0.22 Model includes individual level socio-demographic factors, plus the following neighborhood characteristics:

18
Socioeconomic Risk of Diabetes by ZCTA Diabetes Prevalence By County Insufficient data

19
Summary Disparities for Obesity & Diabetes 1.Disparities in the excess risk of obesity by grew by 6.3 percentage points between 1990 – 2008 2.For diabetes, both relative & absolute disparity by education were fairly constant throughout this period. 3.However, the relative disparity by household income is quite high for diabetes. (2.5 for diabetes, 1.6 for obesity). 4. If adults with HS or less and some college had the same prevalence as college grads…. About 342,000 fewer adults would be obese, and About 96,000 fewer adults would have diabetes 5.For race/ethnicity, the relative disproportion in disparities was greatest for diabetes, and it’s increasing. This is mainly due to growth of diabetes among Hispanics. 6.There are pockets of high risk of diabetes, even among “low prevalence” counties.
. 4. If adults with HS or less and some college had the same prevalence as college grads…. About 342,000 fewer adults would be obese, and About 96,000 fewer adults would have diabetes 5.For race/ethnicity, the relative disproportion in disparities was greatest for diabetes, and it’s increasing. This is mainly due to growth of diabetes among Hispanics. 6.There are pockets of high risk of diabetes, even among low prevalence counties..")
Similar presentations


 to focal child. Includes parents (biological /foster), grandparents,>")


