Download presentation
Presentation is loading. Please wait.

1
GMA 11 Meeting: Model Recalibration/Limitations (TM 16-01) Summary of Scenario 4 (TM 16-02) Storage Discussion Bill Hutchison, Ph.D., P.E., P.G. GMA 11 Meeting March 22, 2016

2
Topics Technical Memorandum 16-01 (Model Recalibration and Model Limitations) Technical Memorandum 16-02 (Summary of Scenario 4) Storage discussion
 Technical Memorandum (Summary of Scenario 4) Storage discussion")
3
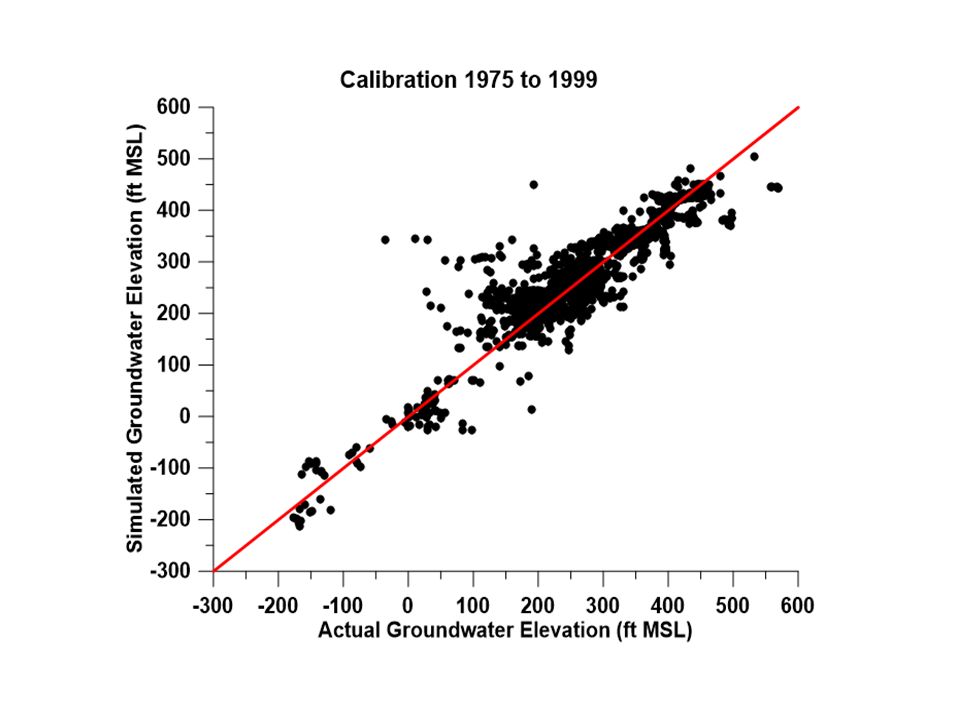
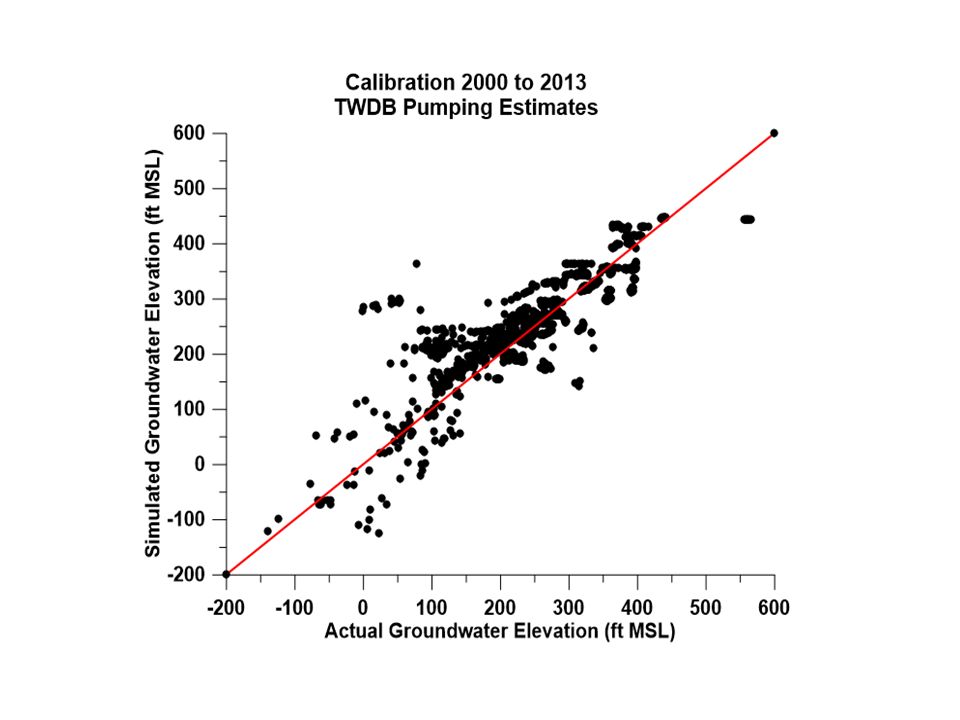
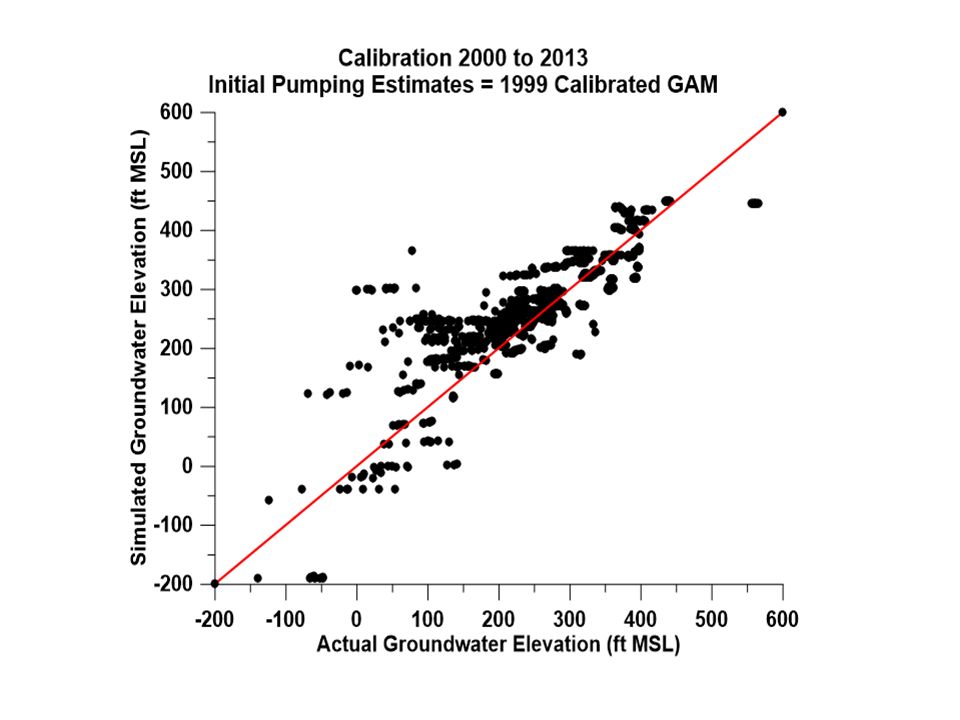
Updating Model Calibration Attempts to update model calibration period did not yield a result that was as good or better than 1975 to 1999 calibration period Identified limitations of the model that are useful in using Scenario 4 results (or results of any scenario) for development of DFCs Documented in Technical Memorandum 16-01
 for development of DFCs Documented in Technical Memorandum 16-01")
4
Summary of Effort 9 PEST runs Total of 7,610 model runs 2000 to 2013 Recharge and ET based on rainfall relationship Pumping based on two approaches: TWDB estimates for 2000 to 2013 Use 1999 pumping from model and allow PEST to adjust to improve fit

8
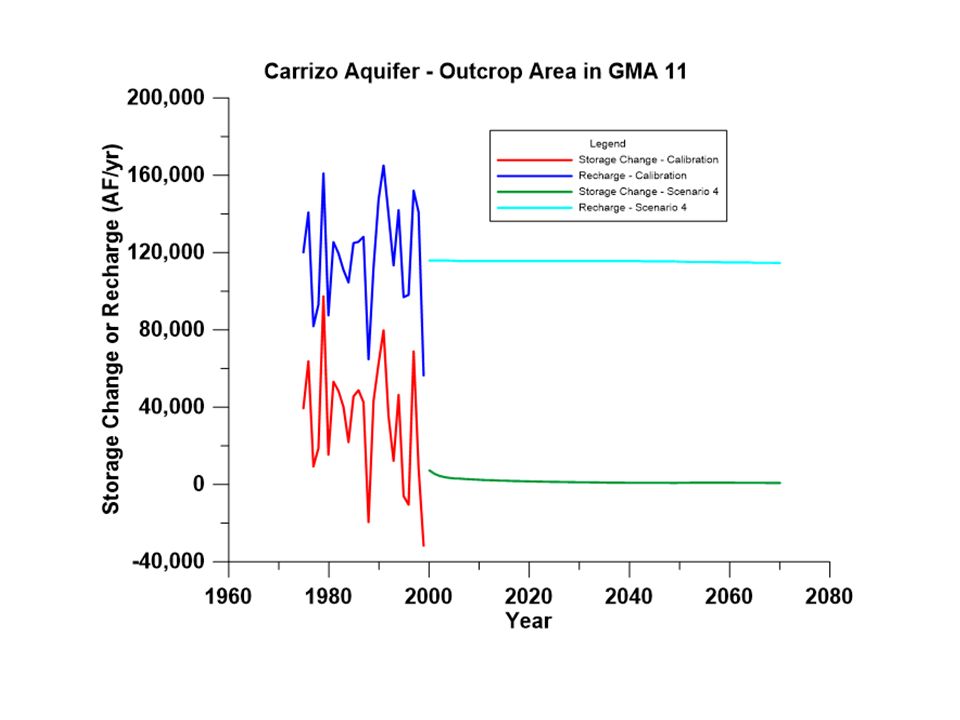
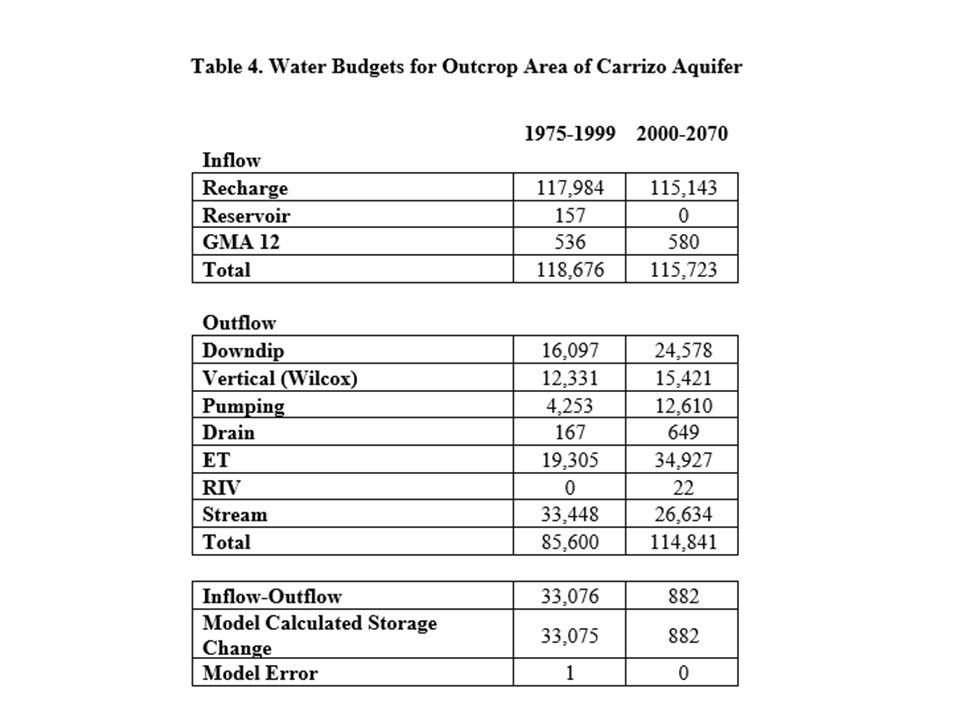
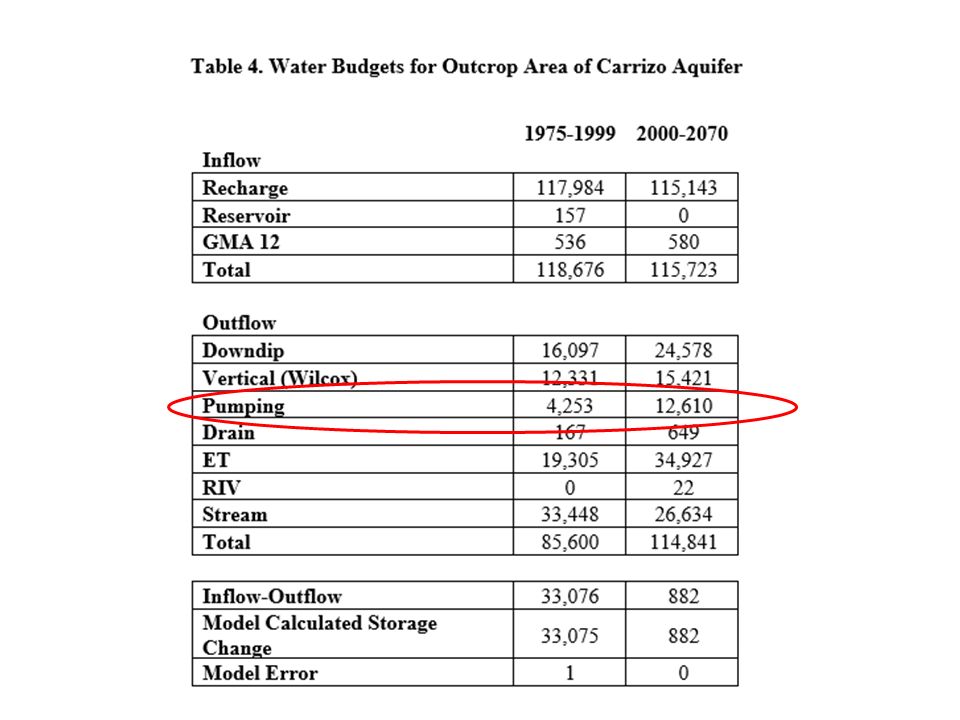
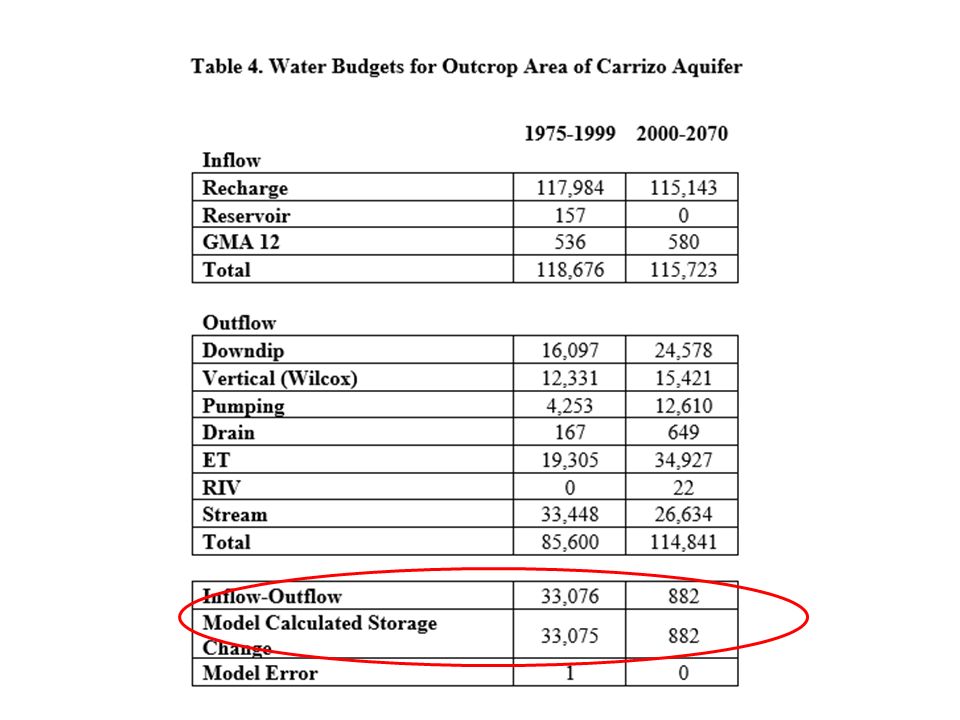
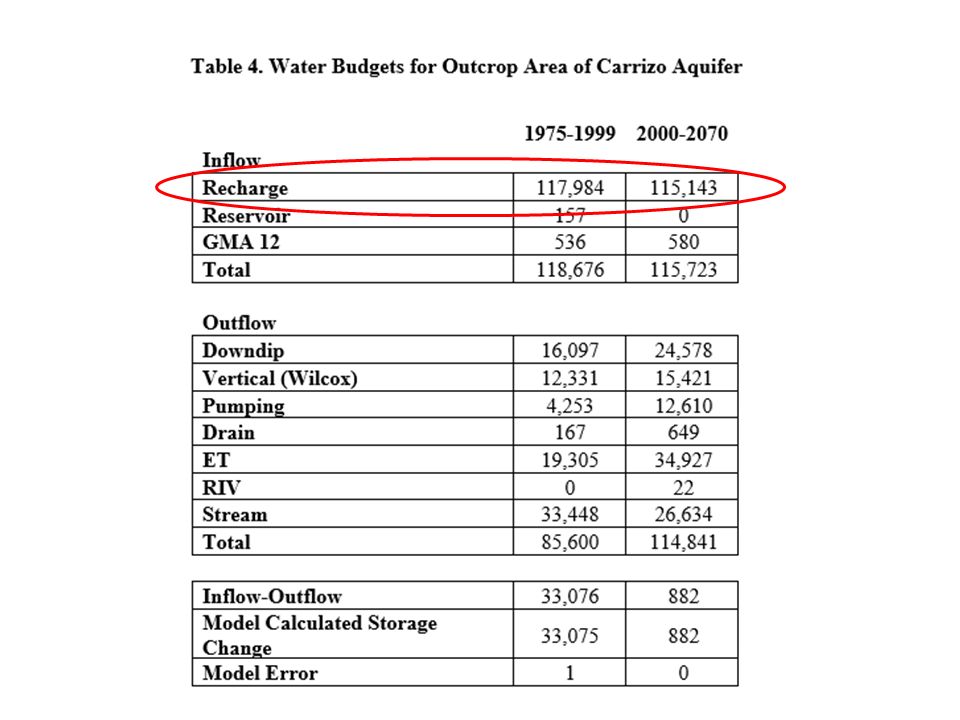
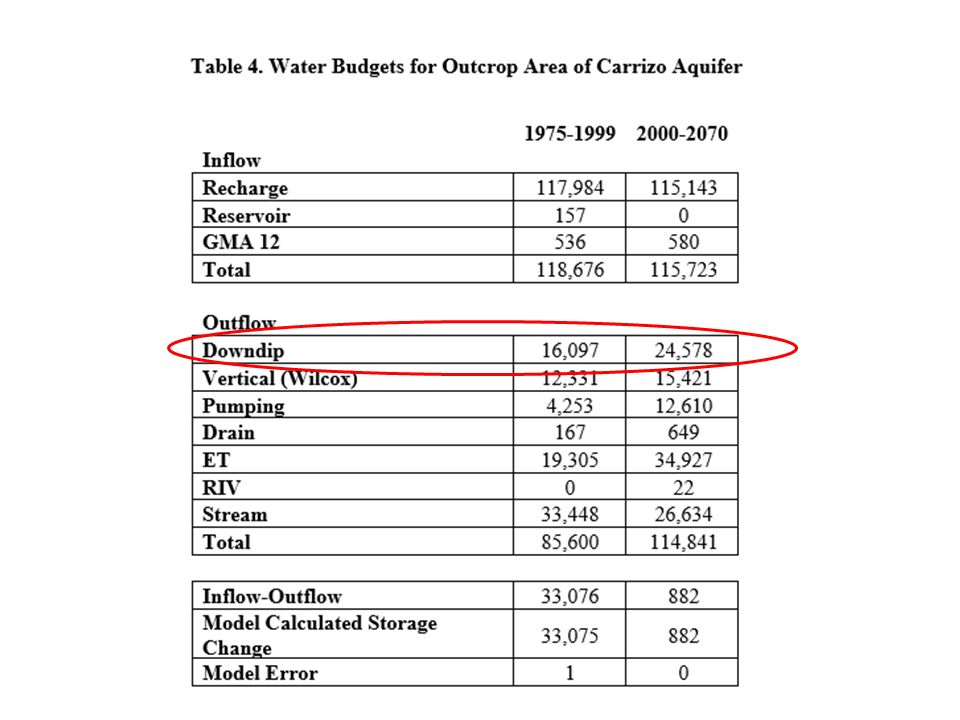
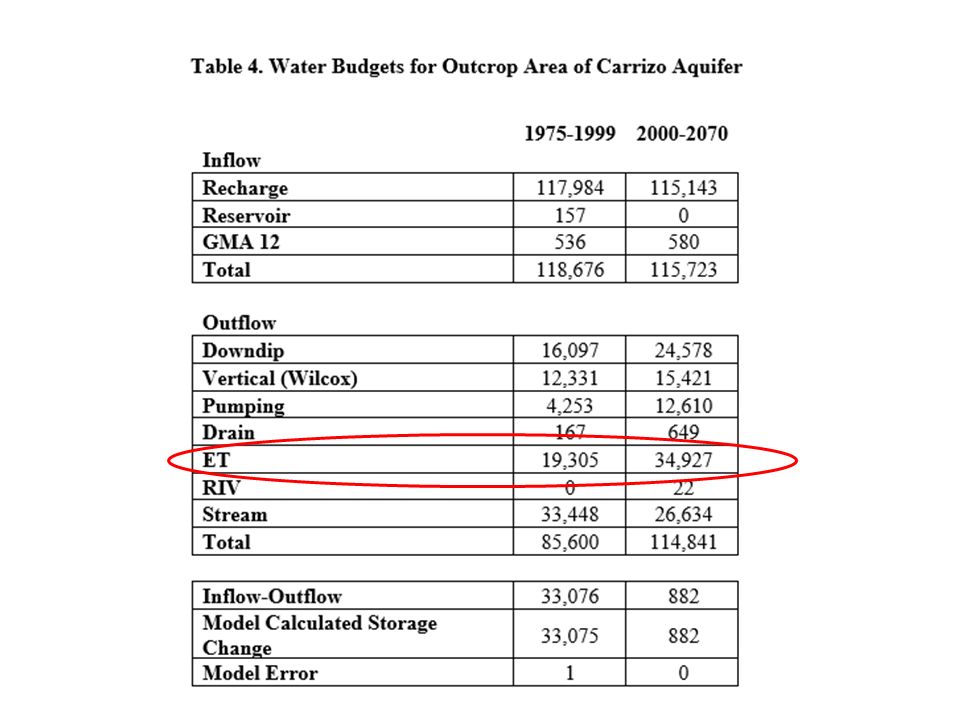
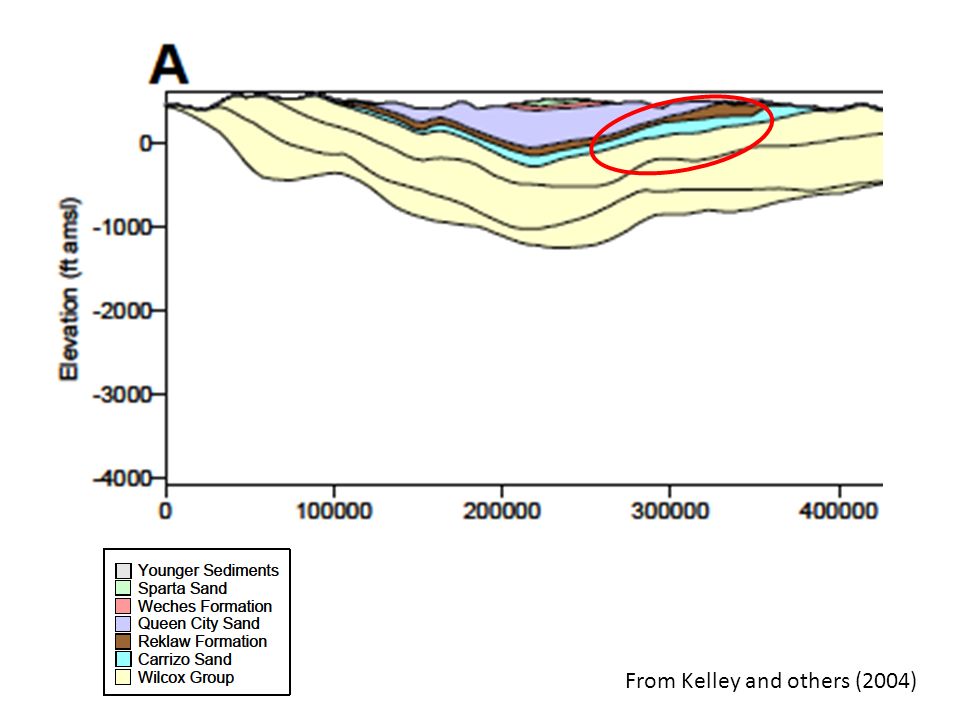
Limitations Identified Problems in outcrop areas Use Carrizo as the example Complex relationship between recharge, ET, discharge to surface water and movement downdip Storage in outcrop area is increasing from 1975 to 1999 in calibrated model Changes in storage are well correlated with recharge

16
Discussion Comparison of 1975-1999 and 2000-2070 Recharge is the same Pumping increases Expect decrease in other outflows and increased inflows ET and Downdip movement increase (not expected) Appears that water cannot discharge, so storage increases ET goes up due to higher heads May be related to high specific yield numbers and not enough downdip movement of water
 Appears that water cannot discharge, so storage increases ET goes up due to higher heads May be related to high specific yield numbers and not enough downdip movement of water")
17
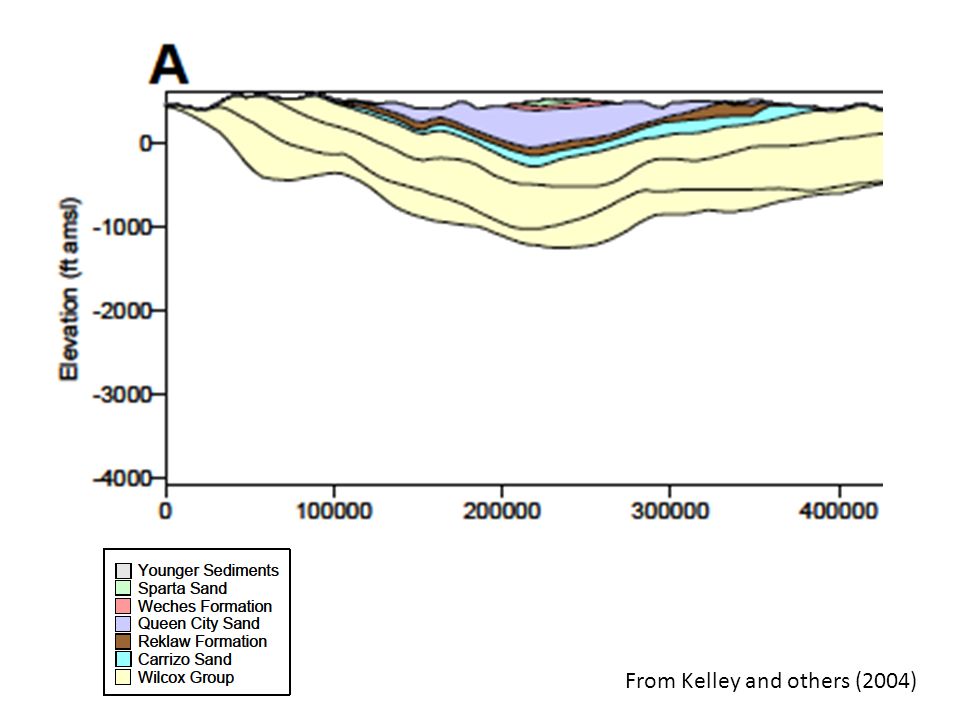
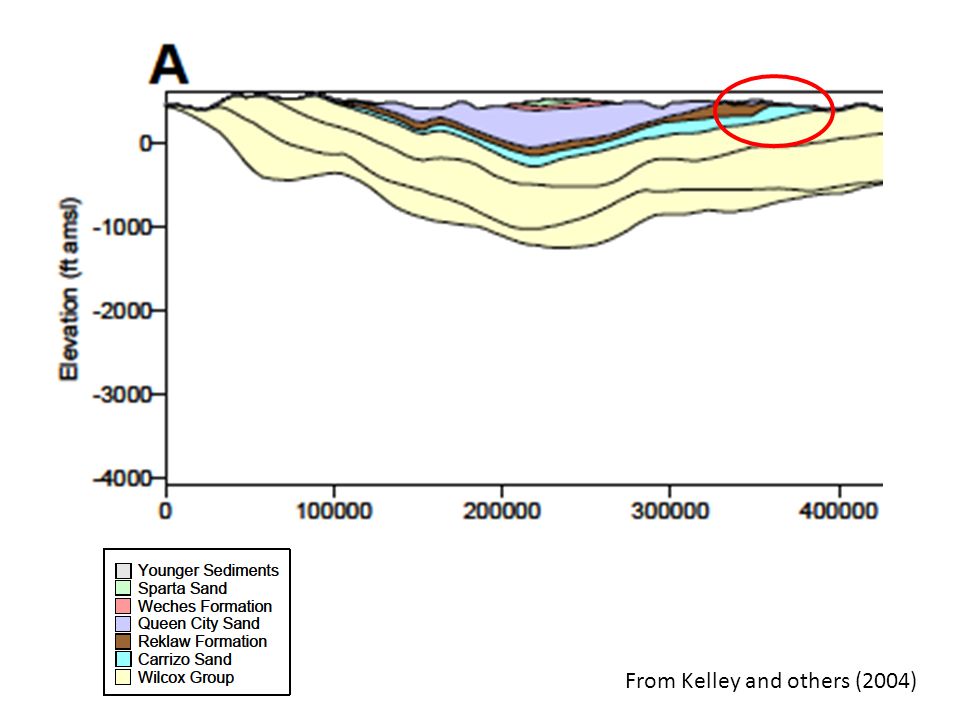
From Kelley and others (2004)
")
20
GMA 11 area 58,269 cells in downdip areas of all aquifers 4,623 cells (8 percent) in 1999 groundwater elevation below the top of the aquifer Uses specific yield and not storativity to estimate changes in head Model may not accurately simulate decreases in groundwater levels due to pumping due to use of higher specific yield value (rather than storativity) Simulated gradient is flatter than reality – can’t move water from outcrop to downdip Storage in outcrop area increases
 in 1999 groundwater elevation below the top of the aquifer Uses specific yield and not storativity to estimate changes in head Model may not accurately simulate decreases in groundwater levels due to pumping due to use of higher specific yield value (rather than storativity) Simulated gradient is flatter than reality – can’t move water from outcrop to downdip Storage in outcrop area increases")
21
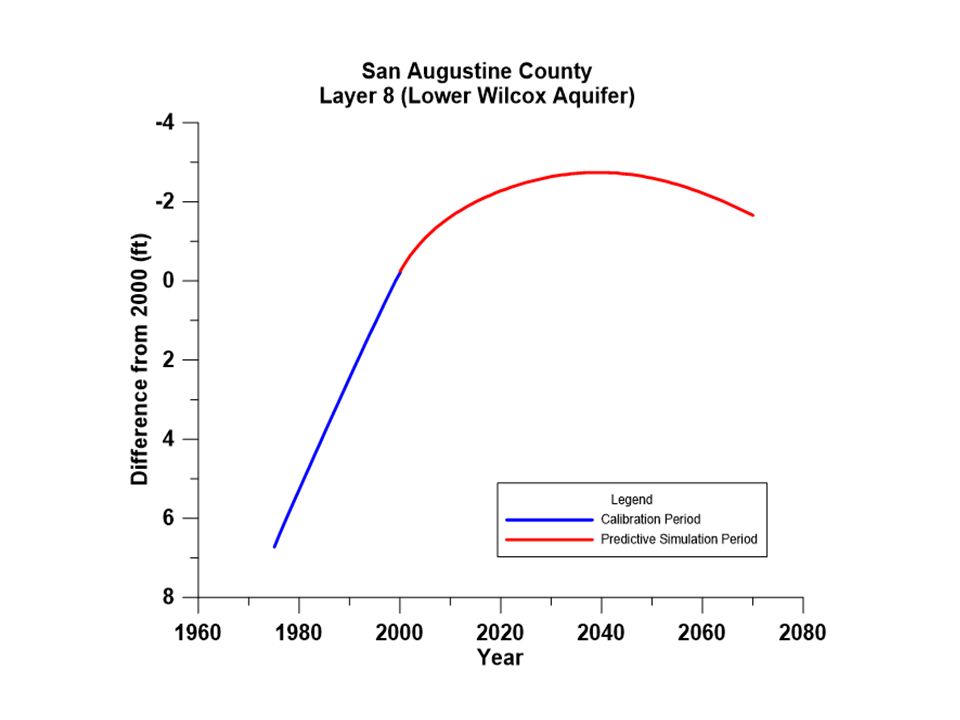
Implications for DFC Note that storage in Scenario 4 is flat (just slightly positive) Can assume that “negative” drawdowns should be zero for DFC calculations (see TM 16-02)
 Can assume that negative drawdowns should be zero for DFC calculations (see TM 16-02)")
22
Good News TWDB is expected to update model of Northern Carrizo-Wilcox, Queen City and Sparta TWDB approved advertising for RFQs for model update (March 21, 2016 TWDB meeting) Work is expected to begin later this year $800,000 budget 2 to 3 year completion New model should be available for next round of joint planning (proposed DFC in spring 2021)
 Work is expected to begin later this year $800,000 budget 2 to 3 year completion New model should be available for next round of joint planning (proposed DFC in spring 2021)")
23
Topics Technical Memorandum 16-01 (Model Recalibration and Model Limitations) Technical Memorandum 16-02 (Summary of Scenario 4) Storage discussion
 Technical Memorandum (Summary of Scenario 4) Storage discussion")
24
Summary of TM 16-02 Scenario 4 chosen since it met the objectives of GMA 11 Included previous MAG concepts (i.e. Queen City) Included RWP strategies (recommended and alternative) Included Forestar project TM can be viewed as a template Tables for a different scenario could be substituted Objective was to provide a summary suitable for presentation to GCD Boards
 Included RWP strategies (recommended and alternative) Included Forestar project TM can be viewed as a template Tables for a different scenario could be substituted Objective was to provide a summary suitable for presentation to GCD Boards.")
25
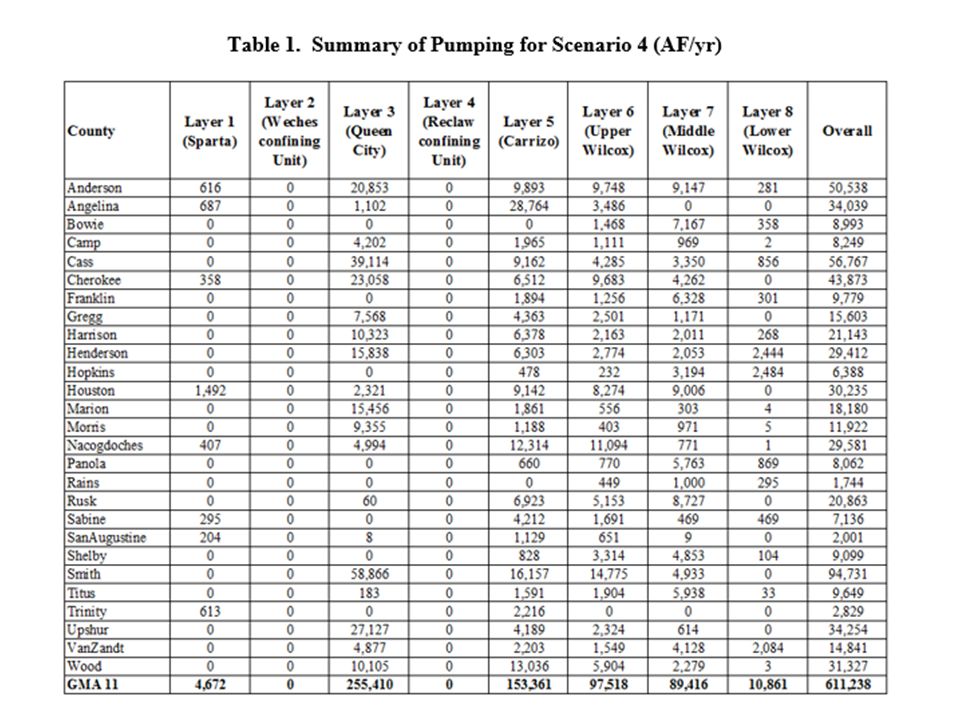
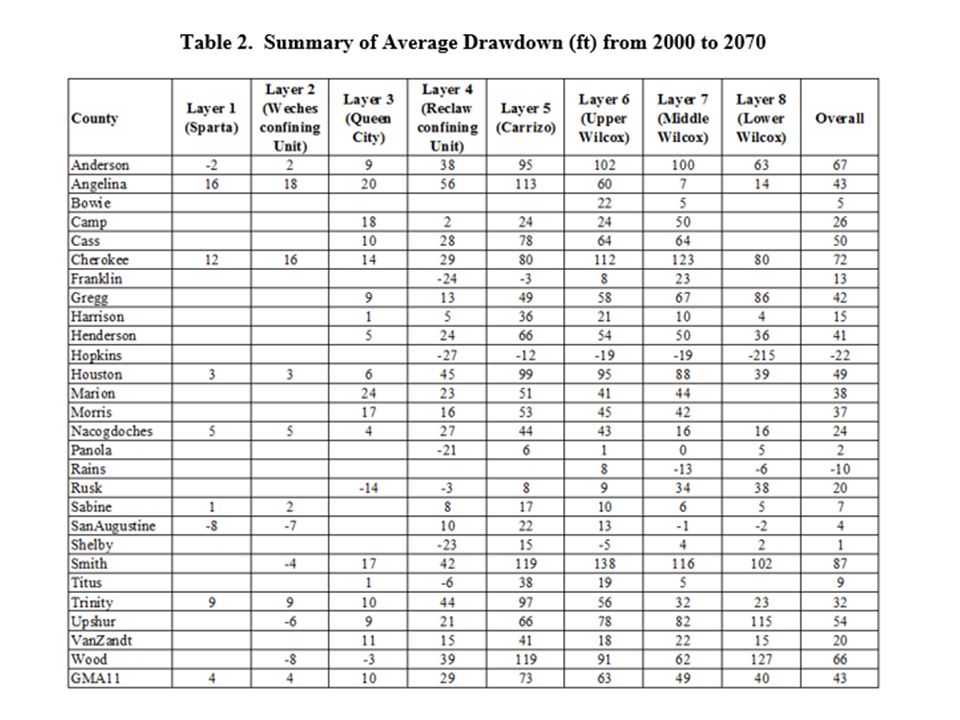
Overview Table 1 – pumping from Scenario 4 Table 2 – drawdown from Scenario 4 (raw)
")
28
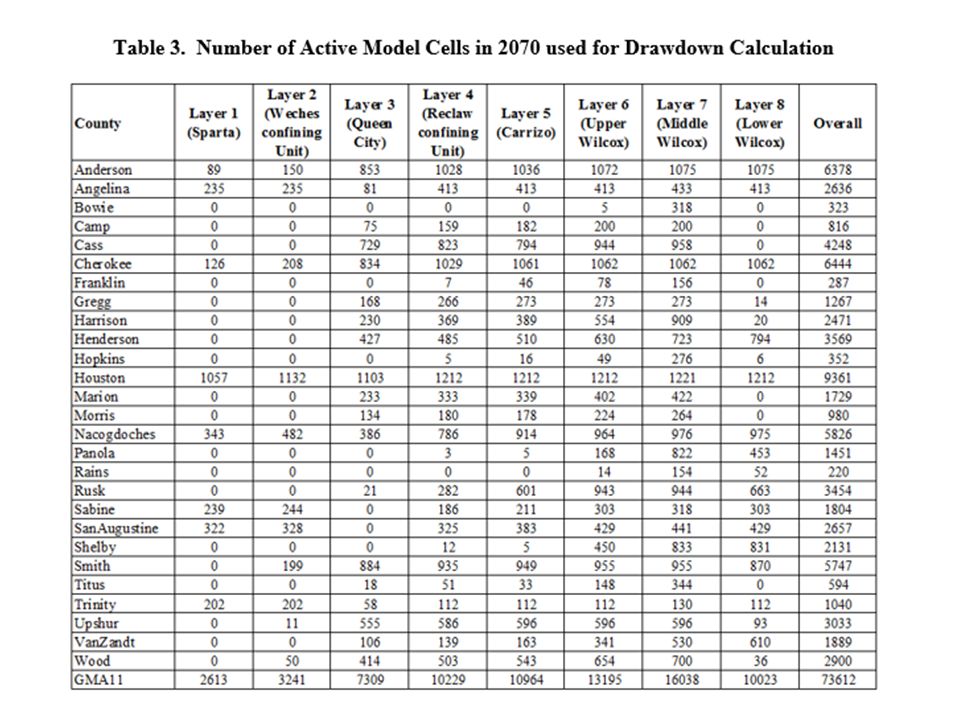
Average Drawdown Not equal drawdown throughout county Model cells are 1 square mile Drawdowns in each cell in a specific county and model layer is summed and then divided by the number of active cells in that county in the model layer Number of active cells is adjusted to account for dry cells (removed from calculation) Table 3 has active cells in 2070
 Table 3 has active cells in 2070")
30
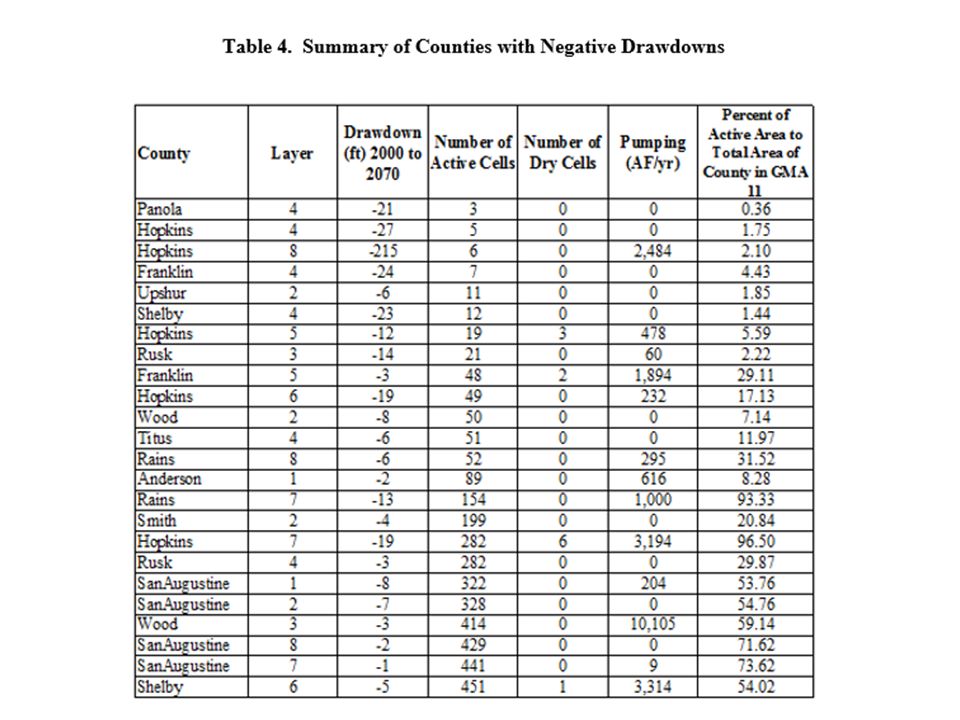
27 Instances of Negative Drawdown in 2070 in Scenario 4 Table 4 summarizes these occurrences County Layer Drawdown Number of Active Cells Number of Dry Cells Pumping Percent of Active Area to Total Area of County in GMA 11

32
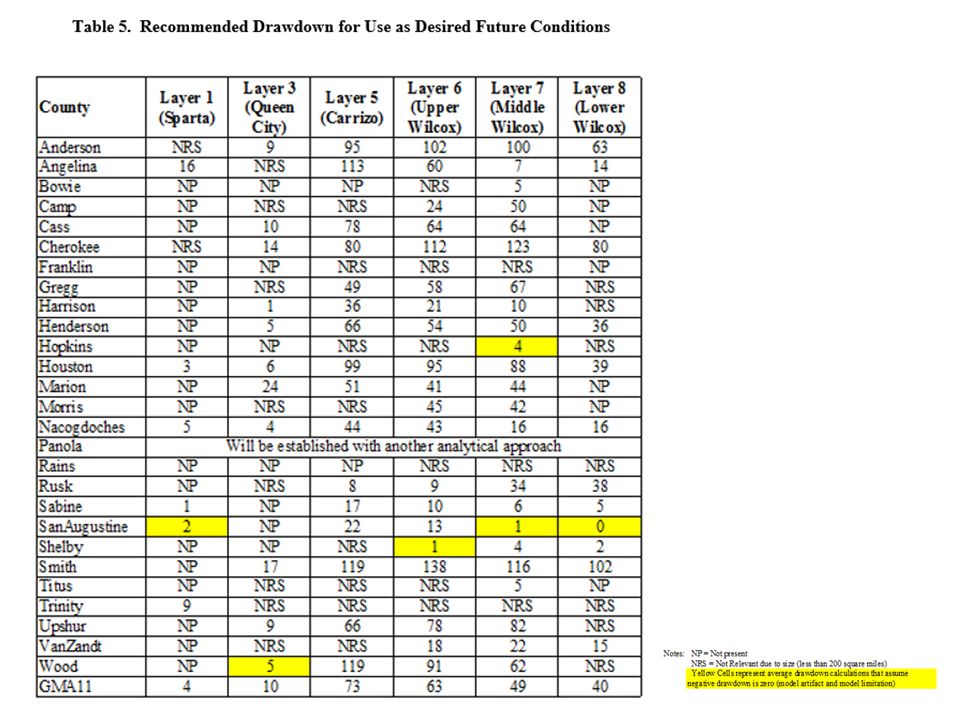
Observations 16 of the 27 are in areas less than 200 square miles 8 of the 27 are in areas greater than 200 square miles One in layer 2 and one in layer 4 (confining units) Recommend that DFCs are defined in aquifer units only Of the six remaining, recommend setting negative drawdowns to zero and recalculating average drawdown Model limitation discussed earlier San Augustine County – Layer 8 as example
 Recommend that DFCs are defined in aquifer units only Of the six remaining, recommend setting negative drawdowns to zero and recalculating average drawdown Model limitation discussed earlier San Augustine County – Layer 8 as example")
34
Summary of Recommendations Remove layers 2 and 4 (confining units) from DFC consideration Remove all areas less than 200 square miles (potential monitoring difficulties) Substitute six instances of negative average drawdown with recalculated average drawdown as described Panola County GCD will provide their values based on Wade’s work
 from DFC consideration Remove all areas less than 200 square miles (potential monitoring difficulties) Substitute six instances of negative average drawdown with recalculated average drawdown as described Panola County GCD will provide their values based on Wade’s work")
36
Topics Technical Memorandum 16-01 (Model Recalibration and Model Limitations) Technical Memorandum 16-02 (Summary of Scenario 4) Storage discussion
 Technical Memorandum (Summary of Scenario 4) Storage discussion")
37
Storage Discussion Part of DFC Factor 3 TWDB Report (GAM Task 13-034) Aquifer Total Storage (million acre-feet) Estimated Range of Recoverable Storage (million acre-feet) Sparta55.313.8 to 41.5 Queen City142.035.5 to 106.5 Carrizo-Wilcox2,070.6517.7 to 1,553.0
 Aquifer Total Storage (million acre-feet) Estimated Range of Recoverable Storage (million acre-feet) Sparta to 41.5 Queen City to Carrizo-Wilcox2, to 1,553.0")
38
Model Limitations and Storage Issues identified and discussed today suggest that some model parameters used in storage calculations may need updating How those parameters affect storage calculations already completed by TWDB

39
Storage Calculations by TWDB Three components Outcrop area Artesian portion of downdip area Saturated portion of downdip area

40
Outcrop Area Saturated thickness: 1999 groundwater elevation minus aquifer bottom elevation Storage = Saturated thickness * Area * Specific Yield Area = 640 acres per cell Specific yield = 0.1 or 0.15 depending on layer Carrizo-Wilcox Aquifer Outcrop = 114 million AF

41
Artesian Portion of Downdip Artesian zone thickness: 1999 groundwater elevation minus elevation of top of aquifer Storage = Artesian zone thickness * Area * Storativity Area = 640 acres per cell Storativity ranges from 7.3E-05 to 9.93E-03 Carrizo-Wilcox Aquifer Artesian Storage = 65 million AF

42
Saturated Portion of Downdip Area Saturated zone thickness: If head below top of aquifer, 1999 groundwater elevation minus elevation of bottom of aquifer If head above top of aquifer, elevation of top of aquifer minus elevation of bottom of aquifer Storage = saturated zone thickness * Area * specific yield Area = 640 acres per cell Specific yield = 0.1 or 0.15 depending on layer Carrizo-Wilcox Aquifer Downdip Saturated Storage = 1,879 million AF

43
Total Storage Outcrop = 114 MAF Downdip (Artesian) = 65 MAF Downdip (Saturated) = 1,879 MAF Total = 2,058 MAF TWDB Estimate is 2,071 MAF Estimate is 2,067 MAF if the correction of downdip areas already below top of aquifer is not made
 = 65 MAF Downdip (Saturated) = 1,879 MAF Total = 2,058 MAF TWDB Estimate is 2,071 MAF Estimate is 2,067 MAF if the correction of downdip areas already below top of aquifer is not made")
44
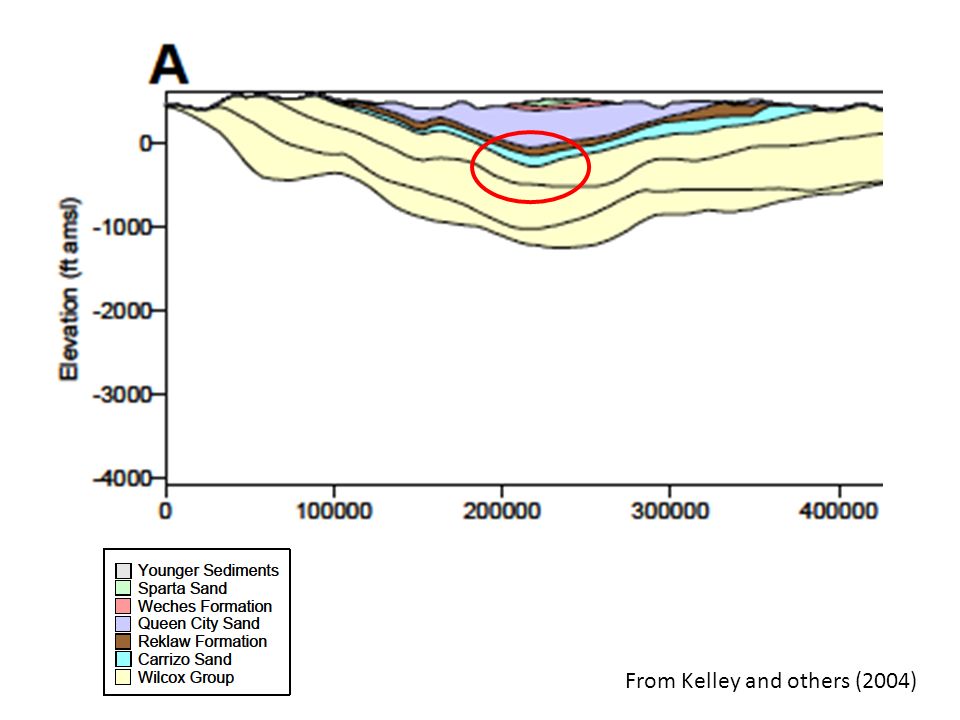
Assumption of Specific Yield MODFLOW requires storativity and specific yield values for each layer (convertible layers) If groundwater is above top – storativity is used If groundwater is below top – specific yield is used In most cases, specific yield is never “used” in model calculations for the downdip areas 23,320 cells of 58,269 total cells in downdip area have artesian head of greater than 500 feet (40 %) Accuracy of specific yield in the deep saturated zone is not known Not part of model calibration
 If groundwater is above top – storativity is used If groundwater is below top – specific yield is used In most cases, specific yield is never used in model calculations for the downdip areas 23,320 cells of 58,269 total cells in downdip area have artesian head of greater than 500 feet (40 %) Accuracy of specific yield in the deep saturated zone is not known Not part of model calibration")
45
From Kelley and others (2004)
")
49
What if the Specific Yield was Different? Specific Yield of 0.1 or 0.15 is representative of clean sand Interlayered system of sands and clays are common in the Carrizo-Wilcox (well logs) Model layering has thick layers 14,107 cells of 58,269 total cells are greater than 500 feet thick (24 percent) With thick cells, changes of interbedded clay increases and this would reduce specific yield in these layers Higher number is appropriate for the individual sand units, thicker layers increases chance that the overall number would be lower
 Model layering has thick layers 14,107 cells of 58,269 total cells are greater than 500 feet thick (24 percent) With thick cells, changes of interbedded clay increases and this would reduce specific yield in these layers Higher number is appropriate for the individual sand units, thicker layers increases chance that the overall number would be lower.")
50
Sensitivity of Specific Yield Minimum storativity is about 0.001 If specific yield in the saturated portion of the downdip area is 0.01 or 0.015 (depending on layer) Outcrop area = 114 MAF (unchanged) Artesian portion of downdip area = 65 MAF (unchanged) Saturated portion of downdip area = 188 MAF Total = 367 MAF Compare to estimate using actual model parameters of 2,058 MAF
 Outcrop area = 114 MAF (unchanged) Artesian portion of downdip area = 65 MAF (unchanged) Saturated portion of downdip area = 188 MAF Total = 367 MAF Compare to estimate using actual model parameters of 2,058 MAF")
51
How Reasonable is Specific Yield Used in the Model When developed in 2004, doubtful that the developers considered the possibility of using the model to calculate total aquifer storage (place holder parameters) Problems in outcrop may be due to flat gradients that reduce flow from outcrop to downdip area Flat gradients can be caused by underestimated drawdown due to pumping or drought conditions If specific yield in these areas was reduced, gradients might improve conditions to move water into downdip area Could prevent unrealistic increase in outcrop storage during calibration period of model
 Problems in outcrop may be due to flat gradients that reduce flow from outcrop to downdip area Flat gradients can be caused by underestimated drawdown due to pumping or drought conditions If specific yield in these areas was reduced, gradients might improve conditions to move water into downdip area Could prevent unrealistic increase in outcrop storage during calibration period of model")
52
Budget Summary Task 1 (Initial Simulations) Technical Memorandum 15-01 (September 2, 2015) Discussion at November 4, 2015 GMA 11 meeting Completed for $12,000
 Technical Memorandum (September 2, 2015) Discussion at November 4, 2015 GMA 11 meeting Completed for $12,000")
53
Budget Summary Task 2 (Update Model Calibration and Rerun Simulations with Updated Pumping) Technical Memorandum 16-01 (March 21, 2016) Technical Memorandum 16-02 (March 21, 2016) Calibration from 2000 to 2013 not as good as 1975 to 1999 No need to rerun simulations No need to fully document model update Reduced level of effort Budget of $6,000 Propose revision to $4,000
 Technical Memorandum (March 21, 2016) Technical Memorandum (March 21, 2016) Calibration from 2000 to 2013 not as good as 1975 to 1999 No need to rerun simulations No need to fully document model update Reduced level of effort Budget of $6,000 Propose revision to $4,000")
54
Budget Summary Task 3 (Use model output to address DFC Factors 3 and 4) Work completed Elements in TM 16-01 and 16-02 Summarized in today’s PowerPoint (Water Budgets and Storage discussion) Recommend expansion and incorporation into Draft Explanatory Report (no separate TM) Budget of $5,000 Propose revision to $4,000
 Work completed Elements in TM and Summarized in today’s PowerPoint (Water Budgets and Storage discussion) Recommend expansion and incorporation into Draft Explanatory Report (no separate TM) Budget of $5,000 Propose revision to $4,000")
55
Budget Summary Task 1 = $12,000 (Completed) To be invoiced after today’s meeting = $8,000 Task 2 = $ 4,000 (Completed – Reduced) Task 3 = $ 4,000 (Completed – Reduced) Total completed to date = $20,000
 To be invoiced after today’s meeting = $8,000 Task 2 = $ 4,000 (Completed – Reduced) Task 3 = $ 4,000 (Completed – Reduced) Total completed to date = $20,000")
56
Proposed Completion Tasks Prior to April 28, 2016 Meeting Task 4 - Document Aquifers Not Relevant for Joint Planning Proposed Cost = $1,500 Task 5 – Prepare Draft Explanatory Report and attend April 29, 2016 GMA 11 meeting Proposed Cost = $8,500

57
Other Aquifers in GMA 11 Trinity Aquifer Nacatoch Aquifer Yegua-Jackson Aquifer and the Catahoula Formation portion of the Gulf Coast Aquifer System Gulf Coast Aquifer System

58
Overall Budget Completed Tasks (1, 2, and 3) - $20,000 Proposed Task 4 - $1,500 Proposed Task 5 - $8,500 Total = $30,000
 - $20,000 Proposed Task 4 - $1,500 Proposed Task 5 - $8,500 Total = $30,000")
59
Questions and Discussion Bill Hutchison, Ph.D., P.E., P.G. billhutch@texasgw.com 512-745-0599

Similar presentations