Download presentation
Presentation is loading. Please wait.

1
Uses of Cancer Data by RTPCT Cancer Chapter of the Public Health Annual Report 2003 Dr José M Ortega

2
Sources of Cancer Information available for PCTs Thames Cancer RegistryThames Cancer Registry London Health ObservatoryLondon Health Observatory ONS:ONS: –Compendium of Clinical and Health Indicators Other sources:Other sources: –Cancer Research UK

3
RTPCT Cancer Report Key points Mortality for all cancers in the LBRuT is lower than that experienced by the rest of London and England as a whole.Mortality for all cancers in the LBRuT is lower than that experienced by the rest of London and England as a whole. 5-year survival rate for lung cancer in LBRuT compares favourably with both London and England.5-year survival rate for lung cancer in LBRuT compares favourably with both London and England. Death rates due to breast cancer are significantly higher than neighbouring PCTs in South West London.Death rates due to breast cancer are significantly higher than neighbouring PCTs in South West London. Screening coverage for breast cancer should increase to reach national standards.Screening coverage for breast cancer should increase to reach national standards. The impact of private mammographies needs to be estimatedThe impact of private mammographies needs to be estimated

4
Trend in mortality, all cancers age<65 Source: Compendium of Clinical and Health Indicators 2002, National Statistics

5
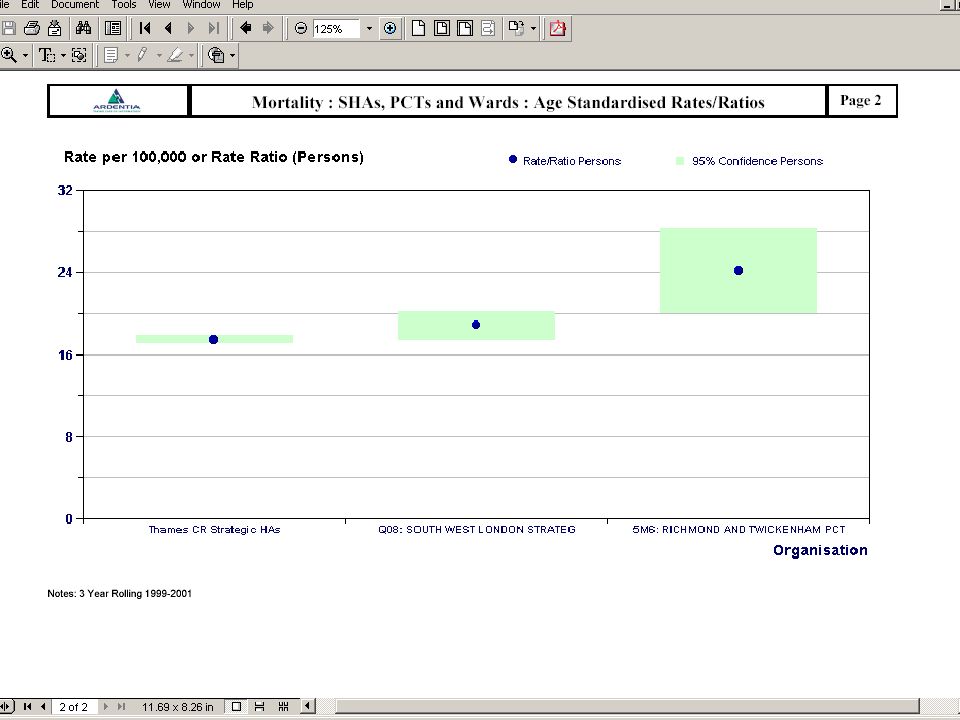
Mortality (SMRs), all cancers, all ages, selected PCTs. Males England = 100 (red line) pooled data 1999-2001 Source: Compendium of Clinical and Health Indicators 2002, National Statistics
 pooled data Source: Compendium of Clinical and Health Indicators 2002, National Statistics.")
6
Mortality (SMRs), all cancers, all ages, selected PCTs. Females England = 100 (red line) pooled data 1999-2001
 pooled data")
7
Years of Life Lost (YLL) to all cancers directly standardised SYLL rate (per 10,000), 1999-2001 Source: Compendium of Clinical and Health Indicators 2002, National Statistics
 to all cancers directly standardised SYLL rate (per 10,000), Source: Compendium of Clinical and Health Indicators 2002, National Statistics")
8
Lung Cancer - Directly Standardised Mortality Rates by sex and selected PCTs Figures for E & W by sex are shown as straight lines (pooled data 1999-2001) Source: Compendium of Clinical and Health Indicators 2002, National Statistics
 Source: Compendium of Clinical and Health Indicators 2002, National Statistics")
9
Breast cancer - Directly Standardised Mortality Rates by selected PCTs (pooled data 1999-2001) E&W as a straight line Source: Compendium of Clinical and Health Indicators 2002, National Statistics
 E&W as a straight line Source: Compendium of Clinical and Health Indicators 2002, National Statistics")
10
Trends in Incidence of Breast Cancer 1993-99 Source: Compendium of Clinical and Health Indicators 2002, National Statistics

11
TRENDS IN MORTALITY FROM BREAST CANCER INDIRECTLY STANDARDISED RATIOS (SMR), 1993-2001 (100=E&W 2001) Source: Compendium of Clinical and Health Indicators 2002, National Statistics
, (100=E&W 2001) Source: Compendium of Clinical and Health Indicators 2002, National Statistics")
12
The New National Cancer Information Service (CIS)
")
15
Breast Cancer Excess Mortality: possible explanations Artifact Worse treatment (unlikely) Different distribution of risk factors –But incidence is similar in neighbouring PCTs Not all incidence cases are registered –Private diagnosis not reported More severe cancer types = worse prognosis –Different histological types (unlikely) –Low screening coverage But this is endemic in London –Private mammographies not picking up tumours at earlier stages (unquantified)
 Different distribution of risk factors –But incidence is similar in neighbouring PCTs Not all incidence cases are registered –Private diagnosis not reported More severe cancer types = worse prognosis –Different histological types (unlikely) –Low screening coverage But this is endemic in London –Private mammographies not picking up tumours at earlier stages (unquantified)")
16
SMRs all cancers, all ages by ward in LBRuT. England SMR =100 (pooled data 1998-2002) Source: London Health Observatory
 Source: London Health Observatory.")
17
Collaboration with TCR most recent data set PCT identification (2)PCT identification (2) Sex and age (2)Sex and age (2) Diagnosis: year and basis (3)Diagnosis: year and basis (3) Survival (1)Survival (1) Death: year, certificates (3)Death: year, certificates (3) ICD 10 (2)ICD 10 (2) Staging (2)Staging (2) Index of deprivation (1)Index of deprivation (1) Treatment by trust and network (14)Treatment by trust and network (14)
PCT identification (2) Sex and age (2)Sex and age (2) Diagnosis: year and basis (3)Diagnosis: year and basis (3) Survival (1)Survival (1) Death: year, certificates (3)Death: year, certificates (3) ICD 10 (2)ICD 10 (2) Staging (2)Staging (2) Index of deprivation (1)Index of deprivation (1) Treatment by trust and network (14)Treatment by trust and network (14)")
18
RTPCT Cancer Report Key points Mortality for all cancers in the LBRuT is lower than that experienced by the rest of London and England as a whole.Mortality for all cancers in the LBRuT is lower than that experienced by the rest of London and England as a whole. 5-year survival rate for lung cancer in LBRuT compares favourably with both London and England.5-year survival rate for lung cancer in LBRuT compares favourably with both London and England. Death rates due to breast cancer are significantly higher than neighbouring PCTs in South West London.Death rates due to breast cancer are significantly higher than neighbouring PCTs in South West London. Screening coverage for breast cancer should increase to reach national standards.Screening coverage for breast cancer should increase to reach national standards. The impact of private mammographies needs to be estimatedThe impact of private mammographies needs to be estimated

Similar presentations


 Highlights from the Northwest Territories Cancer Report March 2014.>")


. Approximately.>")


 and Scotland (SC041666) Cervical Cancer - UK December 2011 For more information.>")

 and Scotland (SC041666) Breast Cancer - UK December 2011 For more information.>")
 and Scotland (SC041666) Cancer Worldwide September 2011.>")

: 2010 Number of New Cases, Crude and European.>")

 UK Renal Registry 2011 Annual Audit Meeting.>")


