Download presentation
Presentation is loading. Please wait.

1
Spatial Analysis in R 06/09/2016 GUND institute for Ecological Economics University of Vermont Insu Koh (ikoh@uvm.edu) Visualization in R

2
Introduction Why do we use R? Types of spatial data Reading and exporting spatial data in R packages / functions Projection Visualization in R Lab!

3
Why do we use R? Spatial data Stats R Graph {RPyGeo} https://r-arcgis.github.io/#R ArcGIS R is slow!!

4
Bivand et al. 2008 p. 5 “R package sp to extend R with classes and methods for spatial data (Pebesma and Bivand, 2005). Classes specify a structure and define how spatial data are organised and stored. Methods are instances of functions specialised for a particular data class.”
. Classes specify a structure and define how spatial data are organised and stored. Methods are instances of functions specialised for a particular data class. .")
5
Basic R Object oriented programming. Four basic data types Vector v <- c(1,2,3,4) vName <- c('a', 'b', 'c', 'd') Matrix m <- matrix(v, nrow=2, ncol=2) Data frame: df <- data.frame(name=vName, value=v) List: l <- list(v, m, df) L <- list(vector=v, matrix=m, dataframe = df) Class of object: class(v) "numeric" class(vName) "character“ class(m) "matrix" Additional source: http://www.statmethods.net/input/datatypes.htmlhttp://www.statmethods.net/input/datatypes.html
 vName <- c( a , b , c , d ) Matrix m <- matrix(v, nrow=2, ncol=2) Data frame: df <- data.frame(name=vName, value=v) List: l <- list(v, m, df) L <- list(vector=v, matrix=m, dataframe = df) Class of object: class(v) numeric class(vName) character class(m) matrix Additional source:")
6
Types of spatial data Point, a single point location, such as a GPS reading or a geocoded address Line, a set of ordered points, connected by straight line segments Polygon, an area, marked by one or more enclosing lines, possibly containing holes Grid, a collection of points or rectangular cells, organized in a regular lattice The sp package provides classes and methods for points, lines, polygons, and grids

7
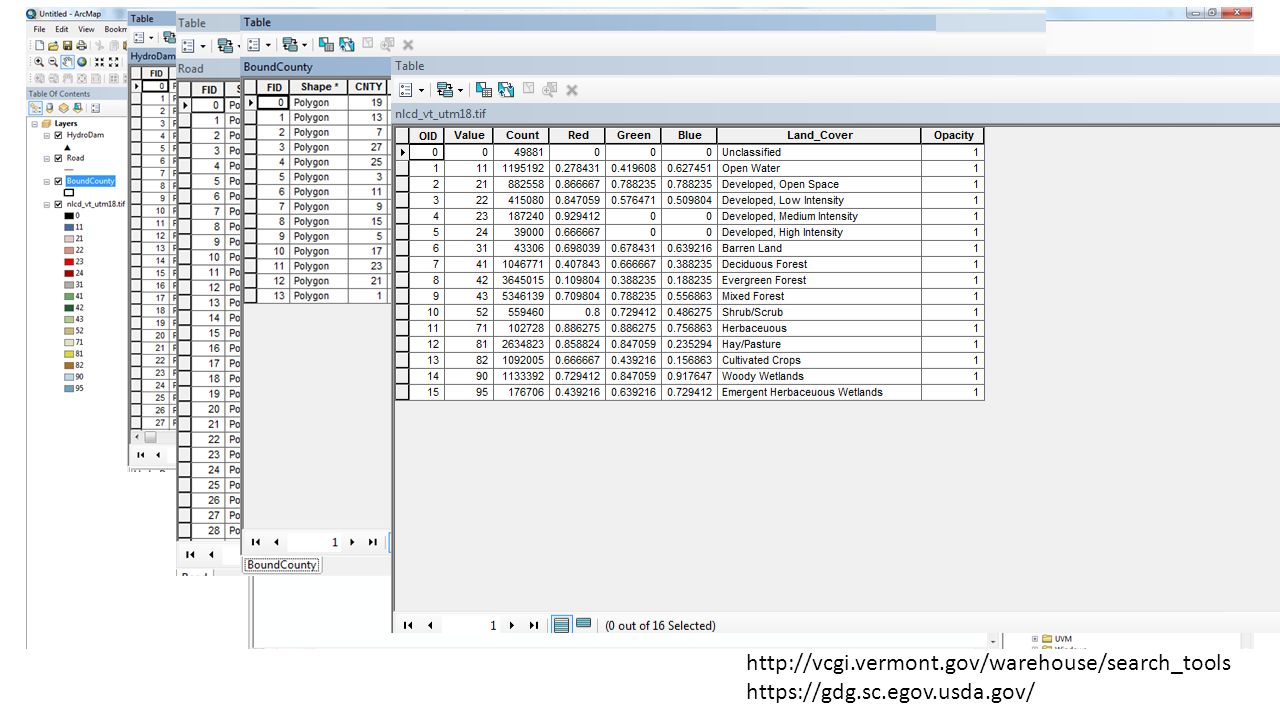
http://vcgi.vermont.gov/warehouse/search_tools https://gdg.sc.egov.usda.gov/
8
Read spatial data in R! library(maptools) readShapeSpatial : for Esri shape file for point, line, and polygon data library(rgdal) readOGR : for all Esri files library(raster) Raster : read all grid file format (.tif,.img,…)
 readShapeSpatial : for Esri shape file for point, line, and polygon data library(rgdal) readOGR : for all Esri files library(raster) Raster : read all grid file format (.tif,.img,…).")
9
Export spatial data in R For point, line, polygon data set. writeOGR(object, dsn = data folder, layer = layer name, driver="ESRI Shapefile") For grid data set writeRaster(object, filename = “data path / file name.extension”)
 For grid data set writeRaster(object, filename = data path / file name.extension ).")
10
Display Basic functions plot: for all spatial data points: for point data lines: for line data ggplot, spplot Looks bad!

11
Coordinate reference systems (CRS) “Coordinate reference systems (CRS) are at the heart of geodetics and cartography: how to represent a bumpy ellipsoid on the plane.” Matching CRS is important to overlay two different spatial data source.
 Coordinate reference systems (CRS) are at the heart of geodetics and cartography: how to represent a bumpy ellipsoid on the plane. Matching CRS is important to overlay two different spatial data source.")
12
Universal Transverse Mercator (UTM) Source: https://www.nceas.ucsb.edu/~frazier/RSpatialGuides/OverviewCoordinateReferenceSystems.pdf The mercator projection preserves angles and direction, but distorts distance. To minimize this distortion, the UTM divides the Earth into sixty zones, and uses a secant transverse Mercator projection in each zone.

13
Projection > proj4string(nlcd) [1] "+proj=utm +zone=18 +ellps=GRS80 +towgs84=0,0,0,0,0,0,0 +units=m +no_defs“ > proj4string(hydroDam) [1] "+proj=tmerc +lat_0=42.5 +lon_0=-72.5 +k=0.9999642857142858 +x_0=500000 +y_0=0 +datum=NAD83 +units=m +no_defs +ellps=GRS80 +towgs84=0,0,0" Functions for reprojection! 1.spTransform(obj1, CRSobj = obj2’s CRS) # for sp data 2.projectRaster(obj1, crs= obj2’s CRS) # for raster data
![Projection > proj4string(nlcd) [1] +proj=utm +zone=18 +ellps=GRS80 +towgs84=0,0,0,0,0,0,0 +units=m +no_defs > proj4string(hydroDam) [1] +proj=tmerc +lat_0=42.5 +lon_0= k= x_0= y_0=0 +datum=NAD83 +units=m +no_defs +ellps=GRS80 +towgs84=0,0,0 Functions for reprojection.](http://images.slideplayer.com/37/10695552/slides/slide_13.jpg "1.spTransform(obj1, CRSobj = obj2’s CRS) # for sp data 2.projectRaster(obj1, crs= obj2’s CRS) # for raster data.")
14
Question? Use R! Download the code and data set

Similar presentations


