Download presentation
Presentation is loading. Please wait.

2
Immigratio n Introductio n

3
Immigration Statistics In 1860, 31.5 million people lived in the U.S. Between 1880-1920, 23 million immigrants arrived in U.S.

4
Immigration Statistics – Most were poor, uneducated – NO quotas – No passport or visa needed 70% of immigrants were from Southern & Eastern Europe

5
Waves of Immigration

6
Countries of Origin Italy Italy Russia Russia Austria- Hungary Austria- Hungary

8
Why do people Immigrate? Push Factors Reasons that people have to leave their homelands – Ex: No jobs, No food, persecution, etc. Pull Factors Reasons that people are drawn to a new nation – Ex: More jobs, Cheaper food, Better opportunities, etc.

9
Why do people Immigrate? Push Factors No Jobs (homeland) Poverty No food/famine Religious or political persecution (especially, Jews and socialists) Pull Factors America had jobs Food prices in US were low Religious and political “tolerance” The American Dream – The belief that anyone can be rich
 Poverty No food/famine Religious or political persecution (especially, Jews and socialists) Pull Factors America had jobs Food prices in US were low Religious and political tolerance The American Dream – The belief that anyone can be rich.")
10
Leaving Home Trip cost between $65-$100. Pay bribes to get permits to leave. Husband and oldest son came first, then the rest of family followed.

11
The Journey 1200-2000 passengers per boat 1-2 week trip Most could only afford steerage (3 rd class; bottom of boat) No windows, 6 ft high ceilings, rows of metal bunks Eat, sleep, seasick in same area One toilet for every 47 - 100 passengers
 No windows, 6 ft high ceilings, rows of metal bunks Eat, sleep, seasick in same area One toilet for every passengers")
12
Arrival Ellis Island – Entry for European immigrants – More than 12 million immigrants processed here – Island in New York City (near Statue of Liberty)
")
13
Immigrant Screening Entrance Requirements: Not diseased/disabled Pass literacy test in native language Prove able to work Have at least $25

14
The Great Hall

15
Medical Examinations

16
Final Destination Only 1/3 of immigrants who came to the US through Ellis Island stayed in NYC. Immigrants were given tags to pin to their hats or coats. Tags showed conductors what lines the immigrants were traveling and what connections to make.

17
“De Facto” Segregation “De Facto” Segregation Means: Immigrants grouped together in cities Most immigrants lived in ethnically homogenous (similar) neighborhoods – Little Italy, Chinatown Security & comfort living amongst people like yourself – Familiar language, food, customs RESULT: cities divided by race and ethnicity
 neighborhoods – Little Italy, Chinatown Security & comfort living amongst people like yourself – Familiar language, food, customs RESULT: cities divided by race and ethnicity")
18
NYC: A city of “Littles”

19
Divided Cities What were the benefits of staying in segregated neighborhoods? What are the disadvantages? What could be done to keep the advantages, but fix the disadvantages?

20
Poor Living Conditions One major disadvantage was the terrible living conditions – Raw sewage and garbage littered the streets – Contagious diseases spread easily – In one district of tenements in NYC, 60% of babies died before first birthday

21
Poor Living Conditions Tenements in New York City

22
Poor Living Conditions Typical tenement house in Toledo, Ohio

23
More on this next time… Increased immigration led to… NATIVISM Belief in a “native” American tradition which needed to be defended against foreign influences. Favored “native-born” (white) Americans. Results in many anti-immigrant policies: – Literacy test (1896) – Chinese Exclusion Act (1882-1943) – Gentlemen’s Agreement (1907-1908)
 Americans. Results in many anti-immigrant policies: – Literacy test (1896) – Chinese Exclusion Act ( ) – Gentlemen’s Agreement ( ).")
24
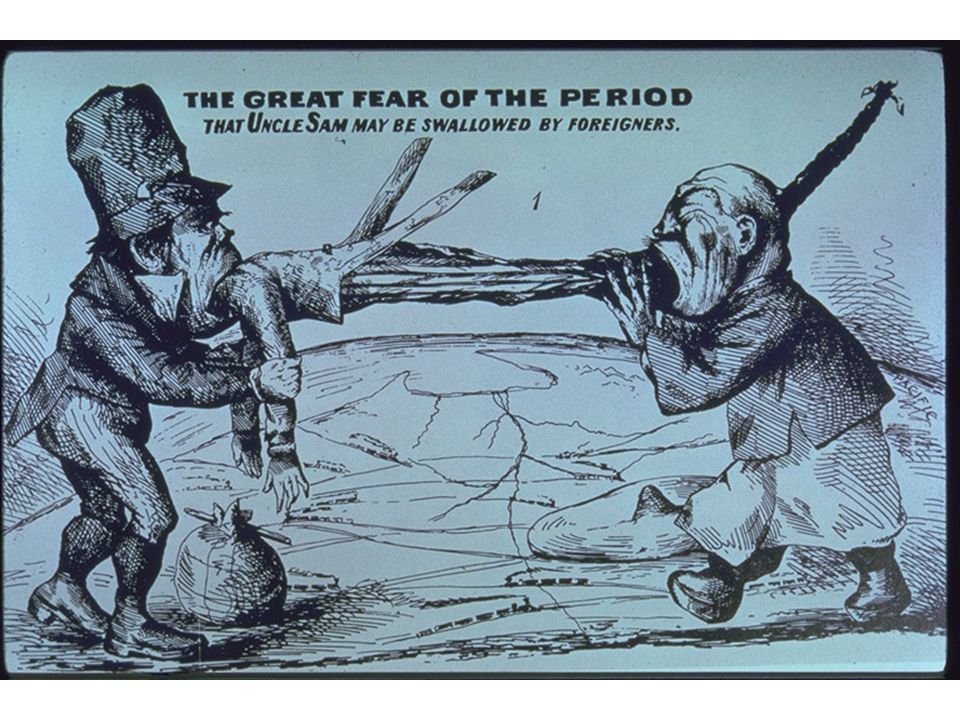
Cartoon Analysis: 3-Steps Remember: Context is key to understanding political cartoons. 3-Step Analysis: ①Describe all the details ②Inferences inside the image: what is it saying? ③Inferences outside the image: what does it teach us about the context?

34
"The Republican Idea Of Protection: A High Tariff on the Monopolist's Wares, Free Entrance for Pauper Labor, and a Lock-Out for the American Workingman."

35
Sign to the left of Uncle Sam : "Free education, free land, free speech, free ballot, free lunch.” Sign near the center: "No oppressive taxes, no expensive kings, no compulsory military service, no knouts or dungeons."

Similar presentations


 Later from southern and eastern Europe.>")
