Download presentation
Presentation is loading. Please wait.

1
SSi Consulting, Inc. Dynamics GP Refreshable Excel Spreadsheets/Dashboards Presentation by Lisa Armstrong, Senior GP Consultant

2
Agenda Reporting Pain Points and Solutions/Benefits What are “Dashboards”? Where/In What Format can I see my Dashboards? Deploying Excel Reports and Data Connections Excel Reports/Dashboards from other sources/connections Smartlist Designer vs. Smartlist Builder/Excel Report Builder Business Analyzer SSRS Reports Q&A Wrap Up

3
Reporting Pain Points My boss keeps asking me for the same report over and over! I have to export a Smartlist and reformat every time I run the report Smartlists only show static information I need other fields on my report that are not available on a regular Smartlist We only have 4 concurrent users, yet 2 others need to inquire on various data in GP I am constantly interrupted to provide customer information to the Sales Manager, financial data to the CFO, Inventory on hand quantities to the Purchasing manager, etc. GP Reports are hard to read

4
Robust Reporting Solutions and Benefits See data in a real time refreshable format (Excel and SSRS) Directly access Dynamics GP data from Excel Allow non-Dynamics GP users to view financial data without using a Dynamics GP license Use the software that you already own (Excel, SSRS) Use the web for reporting – no software needed (MR) Each user likes to see data in a different format/layout You don’t need to start from scratch with your report writing (deployable Excel and SSRS reports) You don’t need a user license to run SSRS or Excel reports with GP 2013 (more on licensing later….)
 Directly access Dynamics GP data from Excel Allow non-Dynamics GP users to view financial data without using a Dynamics GP license Use the software that you already own (Excel, SSRS) Use the web for reporting – no software needed (MR) Each user likes to see data in a different format/layout You don’t need to start from scratch with your report writing (deployable Excel and SSRS reports) You don’t need a user license to run SSRS or Excel reports with GP 2013 (more on licensing later….)")
5
What are Dashboards? The Wikipedia definition: Dashboards often provide at-a-glance views of KPIs (key performance indicators) relevant to a particular objective or business process (e.g. sales, marketing, human resources, or production). [1] The term dashboard originates from the automobile dashboard where drivers monitor the major functions at a glance via the instrument cluster. Dashboards give signs about a business letting the user know something is wrong or something is right. The corporate world has tried for years to come up with a solution that would tell them if their business needed maintenance or if the temperature of their business was running above normal. Dashboards typically are limited to show summaries, key trends, comparisons, and exceptions.key performance indicatorssales marketinghuman resourcesproduction [1]automobiledashboardtrends
 relevant to a particular objective or business process (e.g. sales, marketing, human resources, or production). [1] The term dashboard originates from the automobile dashboard where drivers monitor the major functions at a glance via the instrument cluster. Dashboards give signs about a business letting the user know something is wrong or something is right. The corporate world has tried for years to come up with a solution that would tell them if their business needed maintenance or if the temperature of their business was running above normal. Dashboards typically are limited to show summaries, key trends, comparisons, and exceptions.key performance indicatorssales marketinghuman resourcesproduction [1]automobiledashboardtrends.")
6
What are Dashboards? There are four Key elements to a good dashboard: Simple, communicates easily Minimizes distractions Supports organized business with meaning and useful data Applies human visual perception to visual presentation of information

7
What are Dashboards? In management information systems, a dashboard ismanagement information systems "An easy to read, often single page, real-time user interface, showing a graphical presentation of the current status (snapshot) and historical trends of an organization’s key performance indicators (KPIs) to enable instantaneous and informed decisions to be made at a glance ”key performance indicators
 and historical trends of an organization’s key performance indicators (KPIs) to enable instantaneous and informed decisions to be made at a glance key performance indicators.")
8
Excel Reports Deployment Reports and Data Connections – how to deploy Demonstration of “canned” Excel Reports From within GP – Navigation Lists Opening from the network folder Demonstration of “canned” ODC (Office Data Connection) From within GP – Navigation Lists Opening from the network folder
 From within GP – Navigation Lists Opening from the network folder")
10
Excel Reports and Dashboards Now we can get creative! Dashboard Examples Where does the data come from? SQL Tables, SQL Views,.odc connections, etc. How to determine where I get the data from?

11
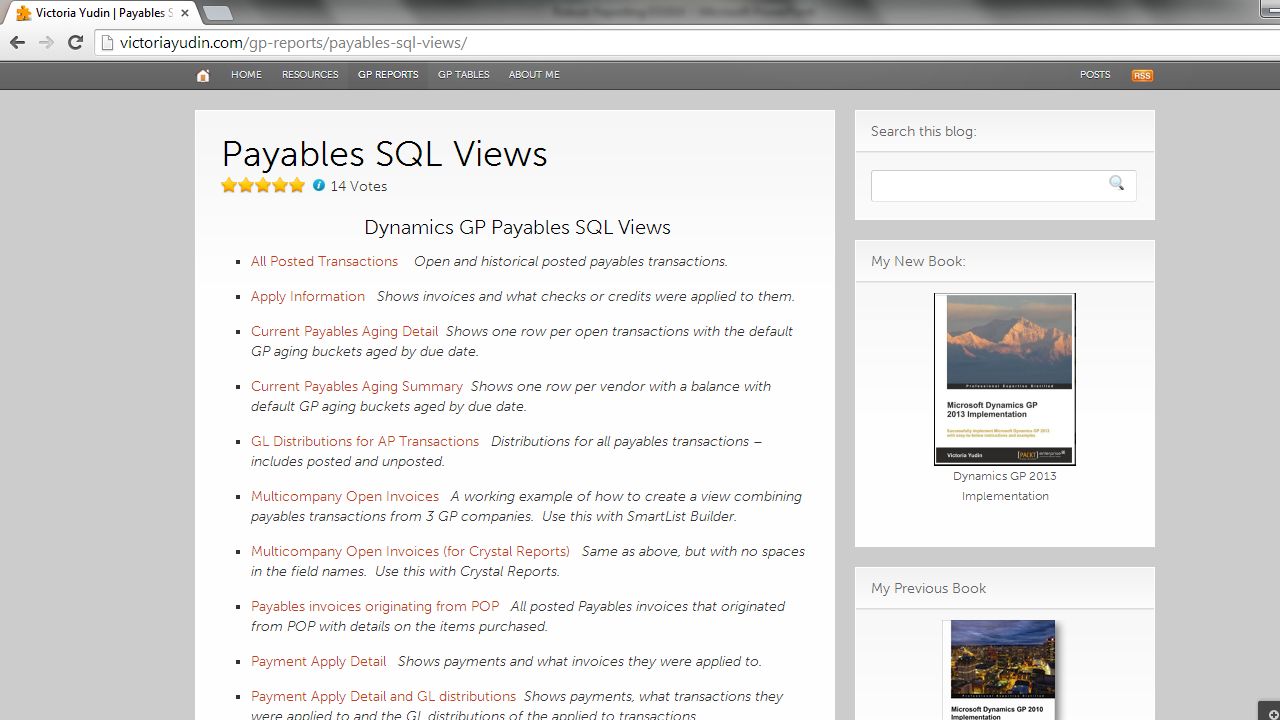
How to find data for your report Dynamics GP->Tools->Resources Provides Tables, Table Descriptions, Fields, Windows Requires a GP login SDK (Software Developer Kit – Installation from GP Software Media) Mark Polino’s Blog Site www.Dynamicaccounting.net SQL Views – Resources www.victoriayudin.com
 Mark Polino’s Blog Site SQL Views – Resources")
20
DEMO

23
A few “Cool” things Excel does! Slicers Timelines Sparklines Add formulas and conditional formatting Power Pivot Power Maps Reporting in your own Excel Style – with refreshable data!

24
Office 365 and Excel Dashboards Your Excel Dashboards Uploaded as a Web Part Demo

34
Security of Excel Reports Must be a domain user / in Active Directory Add through SQL Security Windows Authentication

35
Smartlist Designer GP’s Smartlist Builder, but “FREE” with 2013 SP 2 Smartlist Designer vs. Smartlist Builder Differences: http://eonesolutions.blogspot.com/2013/09/smartlist-design-feature- from-microsoft.html This new tool allows you to create reports on tables found in Microsoft Dynamics GP and any third party application.

36
Business Analyzer A downloadable App from the Windows Store Stand Alone product – part of your GP licensing Uses SSRS prebuilt reports/charts (or you can build your own) Demos
 Demos")
37
Business Analyzer on the desktop

40
Business Analyzer App (Windows Store)
")
41
SSRS Reports Deployment from within GP Business Analyzer uses SSRS Charts and Reports as Dashboards Real Time Refreshable Exportable to Excel

42
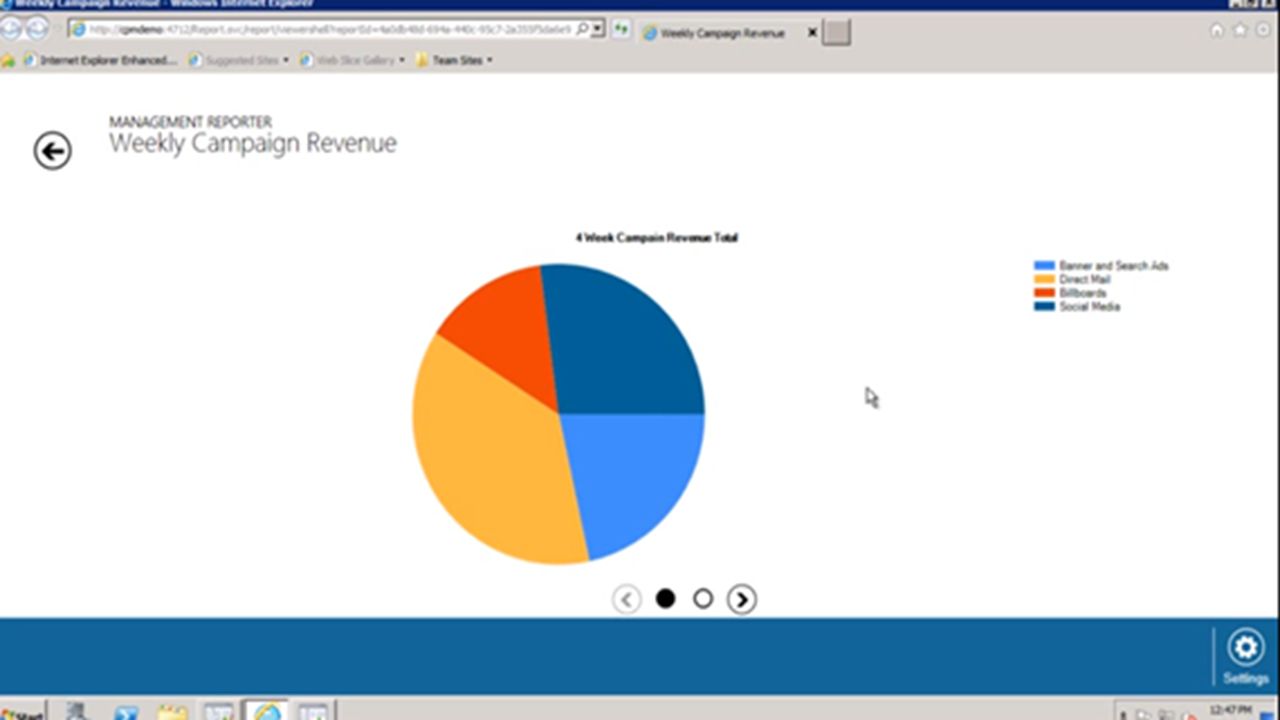
Management Reporter Web Viewer No software needed Uses Active Directory credentials – no GP login needed User is set up in MR as a Viewer Reports are published as a web link in a shared network folder or on Sharepoint Reports are Static Demo

47
MR Web Viewer GoTo Button

48
MR Web Viewer – Download/Export options

49
Review of Reporting Options Smartlist Designer (or Smartlist Builder by eOne) Deploy Excel Reports and Data Connections Deploy SSRS Reports Excel Reports/Dashboards from other sources/connections Business Analyzer SSRS Reports Management Reporter Web Viewer
 Deploy Excel Reports and Data Connections Deploy SSRS Reports Excel Reports/Dashboards from other sources/connections Business Analyzer SSRS Reports Management Reporter Web Viewer")
50
…in Summary You already own all reporting options shown here today (except Smartlist and Excel Report Builder from eOne Business Solutions)! Since you already own them, why not use them? We are happy to work with you with the implementation of any of the products shown here today. We are also happy to set up a more detailed product review/training on any of these reporting products.

51
Q&A

52
Wrap-Up/Next Steps Thank you for attending! Lisa Armstrong Senior GP Consultant, SSi Consulting, Inc larmstrong@ssiconsulting.com 703-389-1890

Similar presentations


 Report Builder (SQL307) Adrian Rupp Business Intelligence Solutions Specialist.>")


