Download presentation
Presentation is loading. Please wait.

1
Risk Management Basics
2015 Andras Bohak|

2
Agenda Risk Basics How Institutional Investors Use Risk Tools
Risk and Return on a Single Equity Manager How an Asset Owner Views the Equity Manager

3
Risk Basics

4
Factor Models in One Slide

5
One Measure of Risk: Standard Deviation
Standard normal curve Distribution of possible outcomes, with a mean of zero and standard deviation of one

6
Standard Deviation of Returns

7
Risk Relative to a Benchmark
Active risk The goal of all active managers is to outperform the benchmark Beating the benchmark requires taking bets by overweighting or underweighting securities Deviating from the benchmark may not result in outperformance Generally the larger the bets, the higher the active risk Bets can be intended or unintended Risk analysis helps ensure that the manager’s intended ideas are implemented without unintended bets negating alpha

8
Risk Relative to a Benchmark

9
How Institutional Investors Use Risk Tools

10
The Investment Process

11
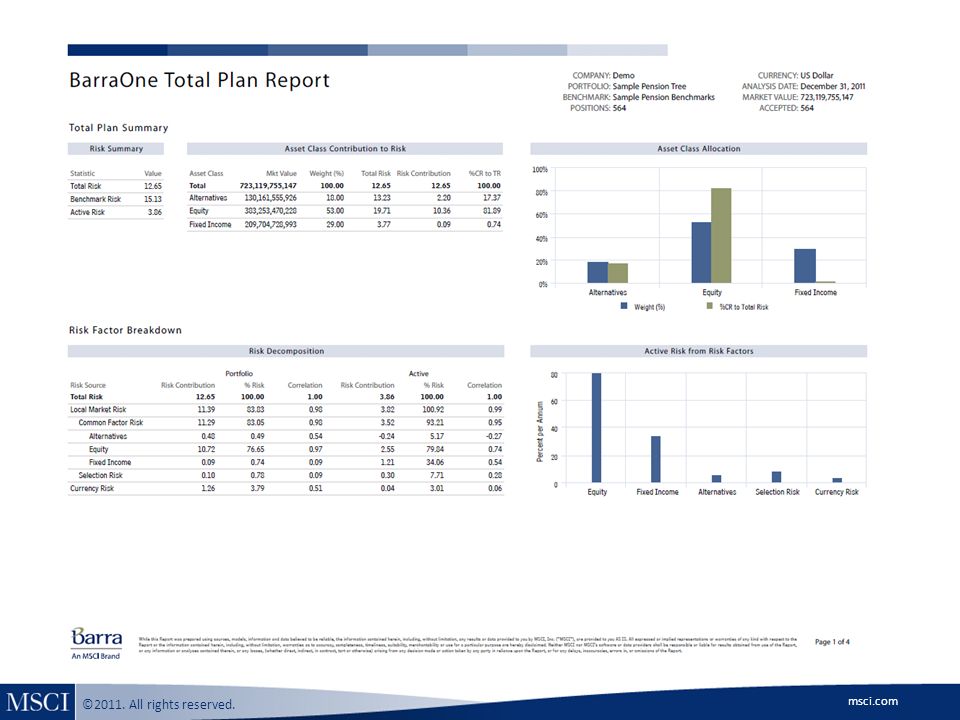
Why Asset Owners Implement Risk Management
Monitor Total Assets Measure the contribution to risk from asset classes, sub asset classes, and managers Analyze Strategic and Tactical Asset Allocations Evaluate plan risk coming from allocation and selection decisions Evaluate Manager Risk and Performance Measure performance against benchmarks, monitor for style drift, and select managers Measure Tail Risk Historical and predictive stress testing, Value at Risk, and Shortfall analysis Perform Risk Budgeting Optimally spend risk, based on traditional asset classes or risk-based buckets

12
Components Needed to Manage Risk
Risk Model Structural Forward Looking Long Horizon Holdings-based Data Holdings Market Data Benchmarks Returns (user-provided) Asset Classes Public Derivatives Private / Illiquid ETFs Mutual Funds Methods Market Values Common Factors Simulations Stress Testing Optimizations Reporting Risk Factors Absolute/Active Space We provide components that can be used to support solutions across the complexity precision spectrum. From holdings-based to index; from market values to VaR simulations. From equities to alternative asset classes. Holdings-based improves modeling precisions. Returns-based model is available for HFs, where no transparency exists. Software Platform
 Asset Classes. Public. Derivatives. Private / Illiquid. ETFs. Mutual Funds. Methods. Market Values. Common Factors. Simulations. Stress Testing. Optimizations. Reporting. Risk Factors. Absolute/Active Space. We provide components that can be used to support solutions across the complexity precision spectrum. From holdings-based to index; from market values to VaR simulations. From equities to alternative asset classes. Holdings-based improves modeling precisions. Returns-based model is available for HFs, where no transparency exists. Software Platform.")
13
A Multi-Dimensional Perspective of Risk and Analytical Models
Front Office vs. Middle Office vs. Aggregators Valuation vs. Simulations, vs. Sensitivities, vs. Factors Holdings-Based vs. Returns-Based Who and Where Risk Lens Model Type

14
A Typical Asset Management Setup
Front Office Middle Office / Aggregators Back Office Typical Roles Portfolio Managers Quant Analysts Risk Managers Asset Allocation Teams Performance Attribution Teams Pension Plan Managers Compliance Performance Reporting Models Types “Analytical” Models Holdings Custom, home-built Valuation Factor (equity) “Risk” Models Hodge-podge Returns Nothing (manager-provided) Factors (growing) Holdings (growing) Portfolio Accounting Trade Order Management Performance Measurement Needs Flexibility and customization Aggregation Structure Automation Predicatibility
 Risk Models. Hodge-podge. Returns. Nothing (manager-provided) Factors (growing) Holdings (growing) Portfolio Accounting. Trade Order Management. Performance Measurement. Needs. Flexibility and customization. Aggregation. Structure. Automation. Predicatibility.")
15
How Investment Risk is Measured Depends on Who You Ask
Fixed Income Manager Duration Spread Risk Default Prepayment Equity Manager Industry exposures Style exposures Commodity Manager Contango Crack spread Macro environment Real Estate Manager Vacancy Operating Income Private Equity Manager Leverage Management Cash Flow Banker Value at Risk Loan Performance Insurer Default Risk Hedge Funds Leverage Plan Sponsor Surplus at Risk Funding Status Risk Manager Total Plan Risk Risk Oversight Liquidity Risk Counterparty Drawdown How do you bring it all together?

16
Measuring Investment Risk Using Holdings Based Models
Investment risk is a function of: Sample Factors Interest Rates Credit Spreads Prepayments Leverage Value/Growth Industries Currencies Risk Position Size Exposure to Factors Factor Volatilities Correlations Between Factors

17
Measuring Investment Risk Using Returns Based Models
Investment risk is a function of: Sample Returns Asset A Asset B Manager A Manager B Risk Historical Return Correlations Between Returns

18
Using Market and Common Factors to Model Risk
Risk analytics are function of pricing models and market or common factors Instruments are mapped to a set of factors Standard instrument pricing models compute exposures to factors Sensitivities & Exposures Stress Testing Simulations (Historical & Monte Carlo) Performance Attribution Factor Risk Market Factors Common Factors * This slide could probably use some arrows, but the point is to show that we have instrument-specific pricing models that are then used to compute exposures to market and/or common factors. Technically in B1, exposures are computed to both market (i.e. durations, stress tests) and common factors (BIM) – but I wouldn’t parse it so fine when discussing this slide with a client. * Make clear when presenting that “sensitivities and exposures” also refers to counterparty risk! Instrument Pricing Models Equities Fixed Income Derivatives Commodities Alternatives
 Performance Attribution. Factor Risk. Market Factors. Common Factors. * This slide could probably use some arrows, but the point is to show that we have instrument-specific pricing models that are then used to compute exposures to market and/or common factors. Technically in B1, exposures are computed to both market (i.e. durations, stress tests) and common factors (BIM) – but I wouldn’t parse it so fine when discussing this slide with a client. * Make clear when presenting that sensitivities and exposures also refers to counterparty risk! Instrument Pricing Models. Equities. Fixed Income. Derivatives. Commodities. Alternatives.")
19
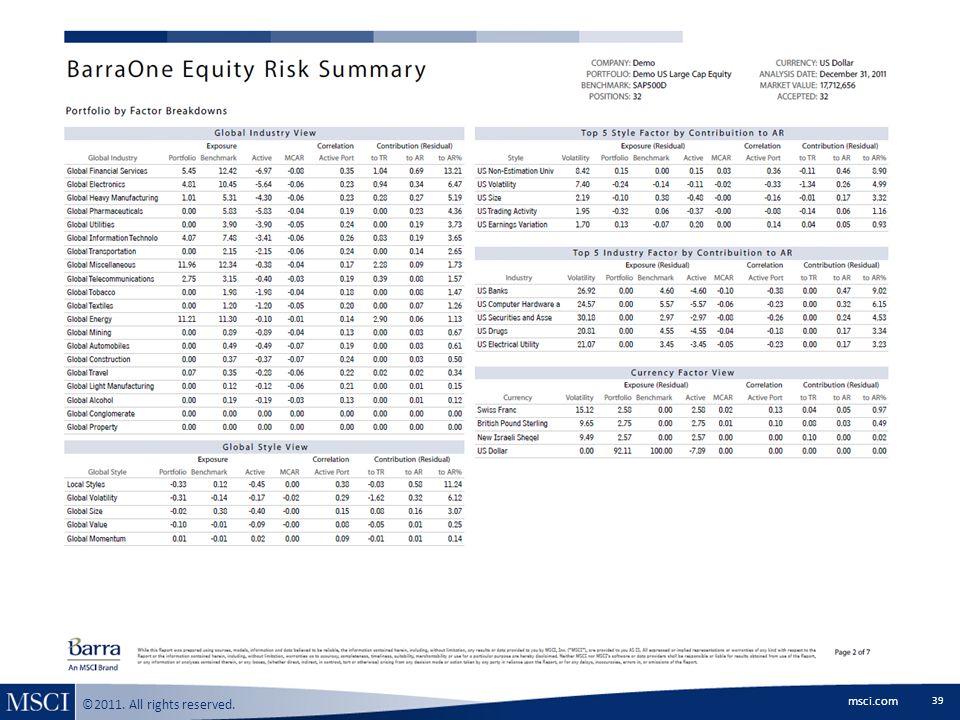
Common Factor Models Identify Sources of Risk
Based on the idea that an instrument’s volatility can be explained more precisely by its characteristics than by looking at historical returns Returns do not capture how an asset’s fundamentals have changed over time Current characteristics provide more insight into drivers of risk Risk is broken down into fundamental market factors to understand sources of risk Explain risk using a smaller set of factors that can be easily explained and used to manage the portfolio Intuitive style, industry, interest rate, and spread factors match the investment process To measure instrument risk, measure its exposure to these factors based on market and fundamental data Some amount of risk is “specific”, or idiosyncratic, to that individual security, and not correlated with common factor movements

20
Typical Factor Model Use Cases
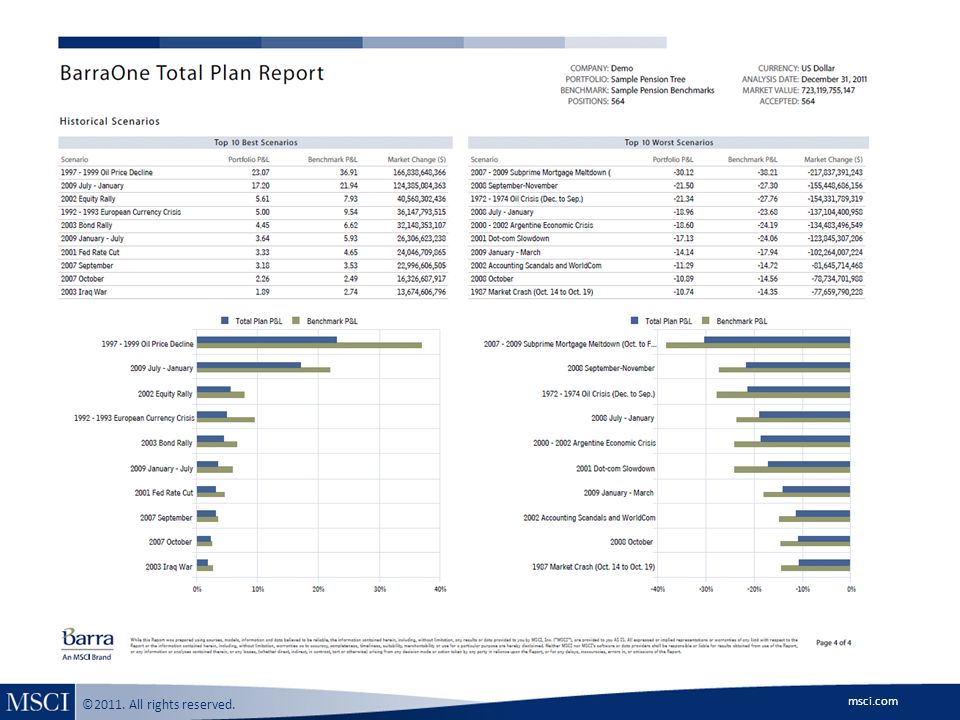
Identify sources of risk and tracking error using fundamental common factors Analyze sources of return using factor-based, or fixed income performance attribution methodologies Identify Sources of Risk and Performance Organize and report risk along the same dimensions that the total plan is managed Monitor portfolio adherence to internal risk budgets Automate production of batch reporting or produce ad-hoc risk reports Monitoring and Report Risk Measure the relationships between fund components or asset classes Analyze Correlations How would the 2001 Fed Rate Cut have impacted my portfolio & AUM income? Historical and Monte Carlo Value at Risk Stress Test Strategies & Simulate Market Conditions

21
Equity Manager

22
Our Equity Manager ~$20M allocation Fundamental manager
Twenty names in automotive industry Equally weighted on No rebalance rules, no subsequent buys/sells Benchmarked to MSCI World

23
Our Equity Manager’s Performance
Portfolio return: -15.3% Benchmark return: -2.5% Active return: -12.8% Information ratio: -0.11 Beta: 1.60

24
Portfolio’s Active Return

25
Portfolio’s Active Return

26
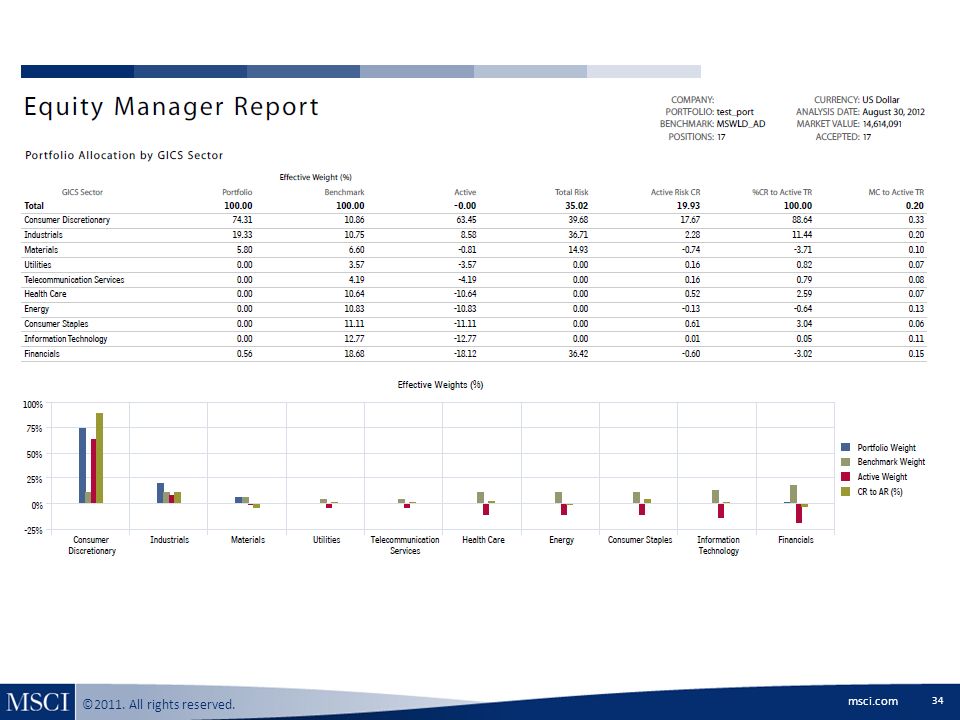
Industry Exposures as of August 2012

27
Our Portfolio: Risk Exposure to Two Industries

28
MSCI World Benchmark: Broad Industry Exposure

29
Single Name Risk Concentration in Our Portfolio

30
US Risk Concentration Across Industries

31
Large Exposure to Style in Automobiles & Components

32
Top Ten Names Drive 90% of Risk

41
RiskManager: Sample Counterparty Credit Exposure
* The Counterparty Credit Exposure Module, powered by RiskManager’s analytics engine, is offered as a separate service from RiskManager

Similar presentations


>")


